CFDs are complex instruments and come with a high risk of losing money rapidly due to leverage. 77% of retail investor accounts lose money when trading CFDs with this provider. You should consider whether you understand how CFDs work and whether you can afford to take the high risk of losing your money.
CFDs are complex instruments and come with a high risk of losing money rapidly due to leverage. 76% of retail investor accounts lose money when trading CFDs with this provider. You should consider whether you can afford to take the high risk of losing your money.

Crude Oil Analysis

US Session Analysis for CFD Instruments 24/06/2021

Fundamental analysis

24 June, 2021

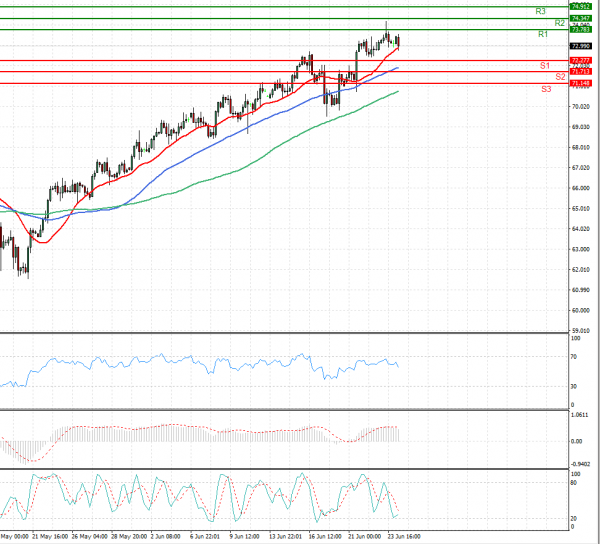
Oil prices gained for a second day on Thursday after drawdowns in U.S. inventories and accelerating German economic activity bolstered confidence in the fuel demand recovery. Doubts about the future of the 2015 Iran nuclear deal that could end U.S. sanctions on Iranian crude exports further supported prices. Both benchmarks hit their highest since October 2018 on Wednesday, but pared gains later in the session as energy traders locked in profit after the U.S. inventory report, Edward Moya, senior market analyst at brokerage OANDA, said in a report. Further stoking expectations of a European fuel demand recovery, data from Germany showed the largest upward leap in retail conditions since German reunification more than three decades ago. Across the Atlantic, U.S. crude inventories fell by 7.6 million barrels in the week to June 18 to 459.1 million barrels, their lowest since March 2020, the U.S. Energy Information Administration said. The drawdown was nearly double analysts' expectations in a Reuters poll for a 3.9 million-barrel drop.

Technical analysis

Crude Oil Analysis Technical analysis 24/06/2021
Time Frame: 1 hour

CRUDEOIL Support & Resistance Table - 24/06/2021

Support & Resistance Level Explanation
Resistance 2 74.347 Daily R2
Resistance 1 73.783 Daily R1
Support 1 72.277 Daily S1
Support 2 71.713 Daily S2

CRUDEOIL Indicator Table - 24/06/2021

Indicator Signal
SMA 20 Buy
SMA 50 Buy
SMA 100 Buy
MACD( 12;26;9) Buy
RSI (14) Buy
Stochastic ( 9;6;3) Sell

CRUDEOIL Indicator / Period Table - 24/06/2021

Indicator / Period Day - BuyWeek - BuyMonth - Buy
MACD( 12;26;9) Buy BuyBuy
RSI (14) Buy BuyBuy
SMA 20 Buy BuyBuy

CRUDEOIL 24/06/2021 - Reference Price : 73.030

Buy
Simple Moving AverageBuy (3)Sell (0)
Technical Indicators - OscillatorsBuy (2)Sell (1)
Share It With Your Network
Crude OIL Chart
Update Time: -
Highest
Lowest
1M 5M H D W
Prices are loading..
Ready for trading?Start Now