CFDs are complex instruments and come with a high risk of losing money rapidly due to leverage. 77% of retail investor accounts lose money when trading CFDs with this provider. You should consider whether you understand how CFDs work and whether you can afford to take the high risk of losing your money.
CFDs are complex instruments and come with a high risk of losing money rapidly due to leverage. 76% of retail investor accounts lose money when trading CFDs with this provider. You should consider whether you can afford to take the high risk of losing your money.

Gold - Usd Dollar Analysis

US Session Analysis for CFD Instruments 22/04/2024

Fundamental analysis

22 April, 2024

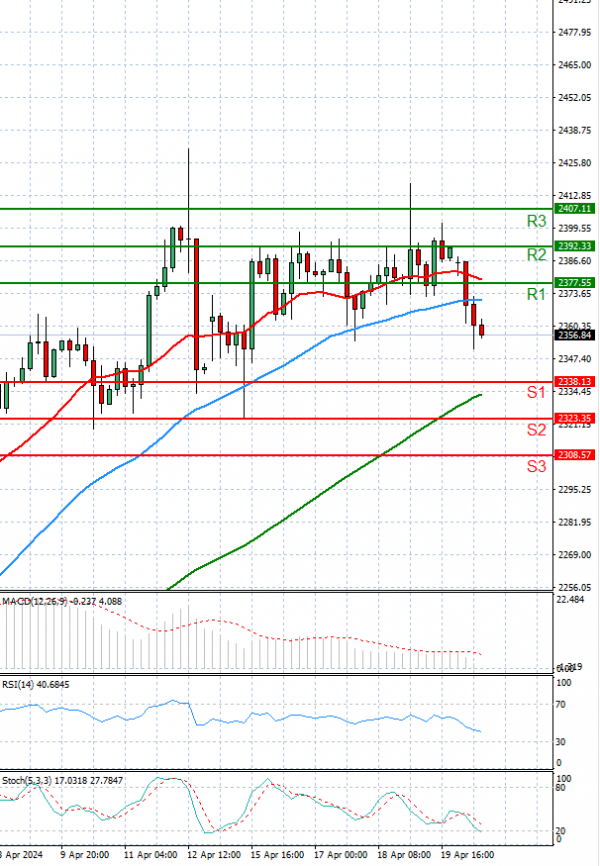
Gold prices are trading in today’s European session below 2370 levels.

Gold prices declined slightly during Monday's European trading session due to reduced concerns about a potential escalation of conflict in the Middle East, which lessened the demand for safe-haven assets.

Additionally, the anticipation of an increase in U.S. interest rates exerted downward pressure on prices. Although tensions between Iran and Israel have been evident recently, Iran's restrained reaction to a Friday strike and the absence of immediate retaliation plans alleviated fears of further escalation, thereby dampening the demand for gold.

However, reports of Iraqi strikes on a U.S. base in Syria, coupled with the ongoing Israeli offensive in Gaza, contributed to geopolitical uncertainties.

Technical analysis

Gold - Usd Dollar Analysis Technical analysis 22/04/2024
Time Frame: 1 hour

GOLD Support & Resistance Table - 22/04/2024

Support & Resistance Level Explanation
Resistance 2 2392.33 Daily R2
Resistance 1 2377.55 Daily R1
Support 1 2338.13 Daily S1
Support 2 2323.35 Daily S2

GOLD Indicator Table - 22/04/2024

Indicator Signal
SMA 20 Sell
SMA 50 Sell
SMA 100 Buy
MACD( 12;26;9) Buy
RSI (14) Sell
Stochastic ( 9;6;3) Sell

GOLD Indicator / Period Table - 22/04/2024

Indicator / Period Day - SellWeek - BuyMonth - Buy
MACD( 12;26;9) Buy BuyBuy
RSI (14) Sell BuyBuy
SMA 20 Sell BuyBuy

GOLD 22/04/2024 - Reference Price : 2357.84

Sell
Simple Moving AverageBuy (1)Sell (2)
Technical Indicators - OscillatorsBuy (1)Sell (2)
Share It With Your Network
GOLD Chart
Update Time: -
Highest
Lowest
1M 5M H D W
Prices are loading..
Ready for trading?Start Now