CFDs are complex instruments and come with a high risk of losing money rapidly due to leverage. 77% of retail investor accounts lose money when trading CFDs with this provider. You should consider whether you understand how CFDs work and whether you can afford to take the high risk of losing your money.
CFDs are complex instruments and come with a high risk of losing money rapidly due to leverage. 76% of retail investor accounts lose money when trading CFDs with this provider. You should consider whether you can afford to take the high risk of losing your money.

Gold - Usd Dollar Analysis

US Session Analysis for CFD Instruments 19/04/2024

Fundamental analysis

19 April, 2024

Gold prices are trading lower in today’s European session below 2390 levels.

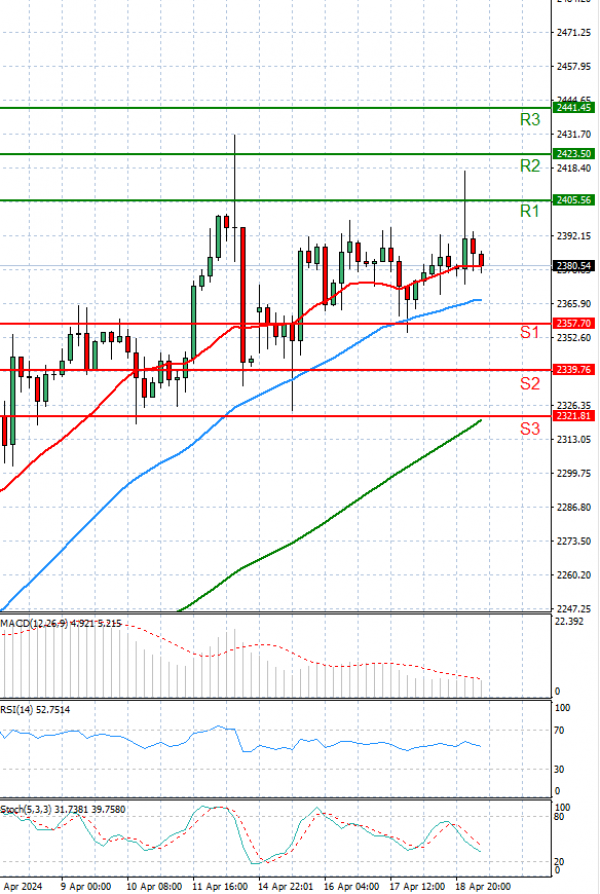
The gold price retreated from today's peak of $2,417 after reaching it earlier.

Currently, the metal is being traded at $2,382. Despite this temporary pullback, the outlook remains optimistic in the medium to long term.

Tensions in the Middle East continue to unsettle markets, thereby boosting gold's attractiveness as a safe haven investment.

Technical analysis

Gold - Usd Dollar Analysis Technical analysis 19/04/2024
Time Frame: 1 hour

GOLD Support & Resistance Table - 19/04/2024

Support & Resistance Level Explanation
Resistance 2 2423.50 Daily R2
Resistance 1 2405.56 Daily R1
Support 1 2357.70 Daily S1
Support 2 2339.76 Daily S2

GOLD Indicator Table - 19/04/2024

Indicator Signal
SMA 20 Neutral
SMA 50 Buy
SMA 100 Buy
MACD( 12;26;9) Buy
RSI (14) Buy
Stochastic ( 9;6;3) Sell

GOLD Indicator / Period Table - 19/04/2024

Indicator / Period Day - BuyWeek - BuyMonth - Buy
MACD( 12;26;9) Buy BuyBuy
RSI (14) Buy BuyBuy
SMA 20 Neutral BuyBuy

GOLD 19/04/2024 - Reference Price : 2381.63

Buy
Simple Moving AverageBuy (2)Sell (0)
Technical Indicators - OscillatorsBuy (2)Sell (1)
Share It With Your Network
GOLD Chart
Update Time: -
Highest
Lowest
1M 5M H D W
Prices are loading..
Ready for trading?Start Now