77% of retail investor accounts lose money when trading CFDs with this provider.
CFDs are complex instruments and come with a high risk of losing money rapidly due to leverage. 77% of retail investor accounts lose money when trading CFDs with this provider. You should consider whether you understand how CFDs work and whether you can afford to take the high risk of losing your money.
76% of retail investor accounts lose money when trading CFDs with this provider.
CFDs are complex instruments and come with a high risk of losing money rapidly due to leverage. 76% of retail investor accounts lose money when trading CFDs with this provider. You should consider whether you can afford to take the high risk of losing your money.
US Session Analysis for CFD Instruments 17/09/2021
Fundamental analysis
17 September, 2021
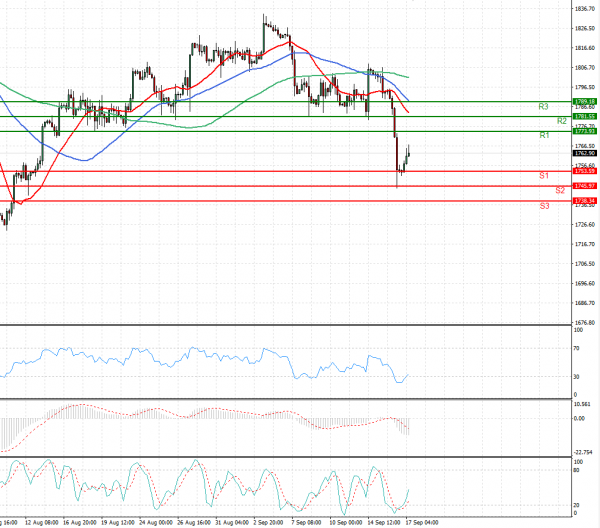
Gold prices rebounded on Friday after sliding to an over one-month low in the previous session, though a firm dollar set the metal on course for a weekly decline as investors awaited next week’s U.S. Federal Reserve policy meeting. The dollar held close to a near three-week peak on Friday, increasing gold’s cost for buyers holding other currencies. Bullion slipped as much as 2.7% on Thursday, as the dollar index jumped after an unexpected increase in U.S. retail sales last month raised expectations of the Federal Reserve potentially reducing its stimulus sooner. The Federal Open Market Committee’s two-day policy meeting is due to be held on Sept. 21-22.