CFDs are complex instruments and come with a high risk of losing money rapidly due to leverage. 77% of retail investor accounts lose money when trading CFDs with this provider. You should consider whether you understand how CFDs work and whether you can afford to take the high risk of losing your money.
CFDs are complex instruments and come with a high risk of losing money rapidly due to leverage. 76% of retail investor accounts lose money when trading CFDs with this provider. You should consider whether you can afford to take the high risk of losing your money.

USA500 Analysis

US Session Analysis for CFD Instruments 18/04/2024

Fundamental analysis

18 April, 2024

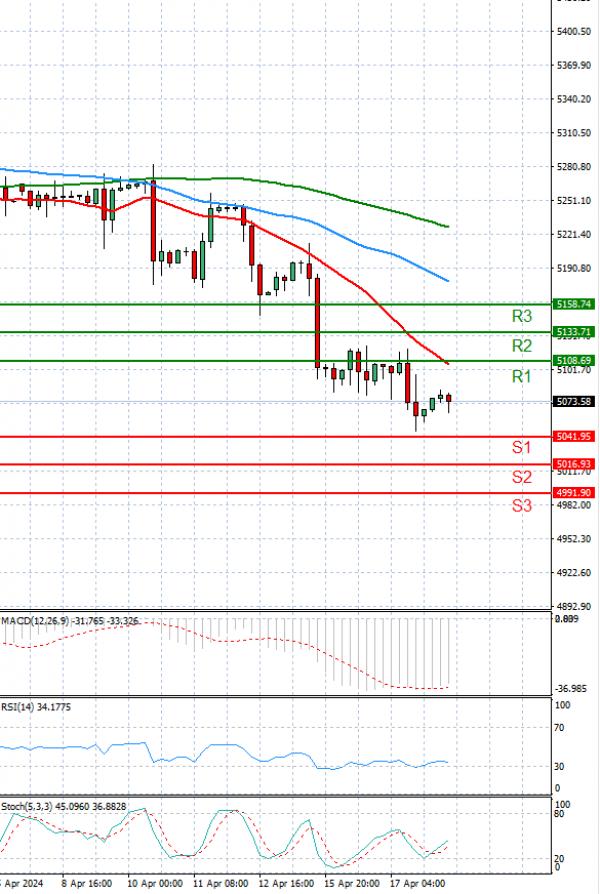
The USA500 is currently trading above 5,000 levels.

Thursday morning was poised to see US stocks opening higher, partially fueled by chipmaker TSMC's robust earnings report.

S&P 500 futures showed a 0.23% gain, although the index remained at a low point amid a four-day downturn. Dow Jones Industrial Average futures rose by 0.14%, while Nasdaq 100 futures surged by 0.37%.

On Wednesday, the tech sector experienced a decline of over 1%, with major players like Nvidia, Meta, Apple, and Microsoft all registering losses.

However, the release of TSMC's impressive earnings results overnight helped reverse this trend in pre-market trading.

TSMC's reported 9% increase in net income surpassed expectations, potentially bolstering market optimism regarding the sustainability of AI demand.

Technical analysis

USA500 Analysis Technical analysis 18/04/2024
Time Frame: 1 hour

USA500 Support & Resistance Table - 18/04/2024

Support & Resistance Level Explanation
Resistance 2 5133.71 Daily R2
Resistance 1 5108.69 Daily R1
Support 1 5041.95 Daily S1
Support 2 5016.93 Daily S2

USA500 Indicator Table - 18/04/2024

Indicator Signal
SMA 20 Sell
SMA 50 Sell
SMA 100 Sell
MACD( 12;26;9) Sell
RSI (14) Sell
Stochastic ( 9;6;3) Sell

USA500 Indicator / Period Table - 18/04/2024

Indicator / Period Day - SellWeek - SellMonth - Buy
MACD( 12;26;9) Sell BuyBuy
RSI (14) Sell SellBuy
SMA 20 Sell SellBuy

USA500 18/04/2024 - Reference Price : 5075.32

Sell
Simple Moving AverageBuy (0)Sell (3)
Technical Indicators - OscillatorsBuy (0)Sell (3)
Share It With Your Network
USA500 Chart
Update Time: -
Highest
Lowest
1M 5M H D W
Prices are loading..
Ready for trading?Start Now