CFDs are complex instruments and come with a high risk of losing money rapidly due to leverage. 77% of retail investor accounts lose money when trading CFDs with this provider. You should consider whether you understand how CFDs work and whether you can afford to take the high risk of losing your money.
CFDs are complex instruments and come with a high risk of losing money rapidly due to leverage. 76% of retail investor accounts lose money when trading CFDs with this provider. You should consider whether you can afford to take the high risk of losing your money.

USA500 Analysis

US Session Analysis for CFD Instruments 25/04/2024

Fundamental analysis

25 April, 2024

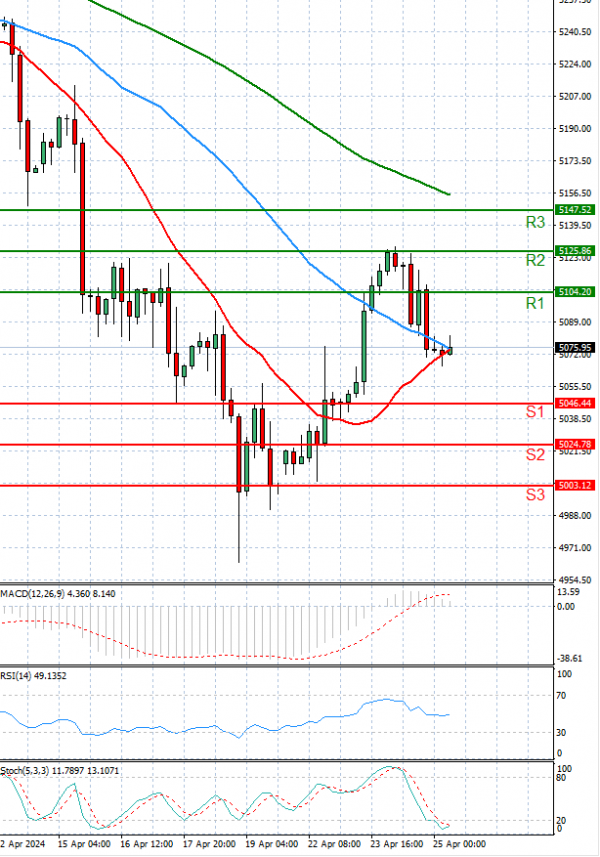
The USA500 is currently trading below 5,100 levels.

US stock futures indicated a downward trend on Thursday as investors evaluated earnings reports from prominent technology firms and awaited the release of fresh US economic growth data.

The Dow futures contract showed a decline of 95 points, or 0.2%, while S&P 500 futures dipped by 34 points, or 0.7%, and Nasdaq 100 futures slipped by 211 points, or 1.2%.

In the previous session, Wall Street's major indices closed with a mixed performance after a day of volatile trading. The benchmark S&P 500 saw a marginal gain of 0.02%, while the tech-centric Nasdaq Composite rose by 0.1%. Conversely, the Dow Jones Industrial Average, comprising 30 stocks, experienced a slight decline of 0.1%.

Technical analysis

USA500 Analysis Technical analysis 25/04/2024
Time Frame: 1 hour

USA500 Support & Resistance Table - 25/04/2024

Support & Resistance Level Explanation
Resistance 2 5125.86 Daily R2
Resistance 1 5104.20 Daily R1
Support 1 5046.44 Daily S1
Support 2 5024.78 Daily S2

USA500 Indicator Table - 25/04/2024

Indicator Signal
SMA 20 Sell
SMA 50 Sell
SMA 100 Sell
MACD( 12;26;9) Buy
RSI (14) Sell
Stochastic ( 9;6;3) Sell

USA500 Indicator / Period Table - 25/04/2024

Indicator / Period Day - SellWeek - SellMonth - Buy
MACD( 12;26;9) Buy SellBuy
RSI (14) Sell SellBuy
SMA 20 Sell SellBuy

USA500 25/04/2024 - Reference Price : 5075.32

Sell
Simple Moving AverageBuy (0)Sell (3)
Technical Indicators - OscillatorsBuy (1)Sell (2)
Share It With Your Network
USA500 Chart
Update Time: -
Highest
Lowest
1M 5M H D W
Prices are loading..
Ready for trading?Start Now