CFDs are complex instruments and come with a high risk of losing money rapidly due to leverage. 77% of retail investor accounts lose money when trading CFDs with this provider. You should consider whether you understand how CFDs work and whether you can afford to take the high risk of losing your money.
CFDs are complex instruments and come with a high risk of losing money rapidly due to leverage. 76% of retail investor accounts lose money when trading CFDs with this provider. You should consider whether you can afford to take the high risk of losing your money.

USA500 Analysis

US Session Analysis for CFD Instruments 24/04/2024

Fundamental analysis

24 April, 2024

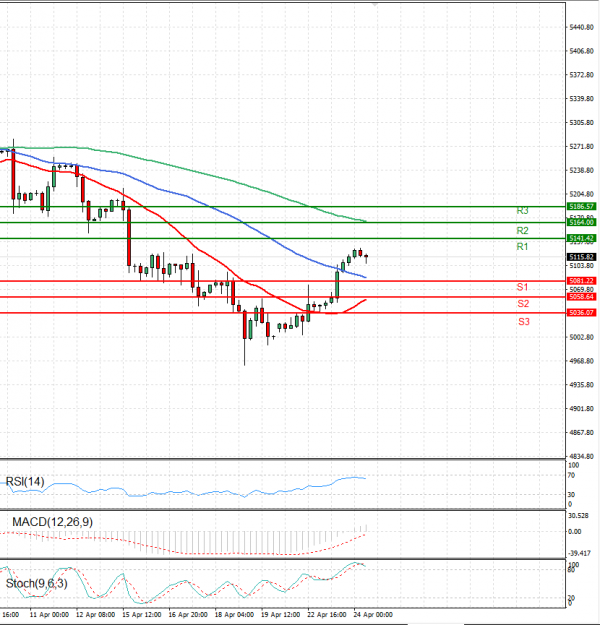
The USA500 is currently trading above 5,000 levels.

Wednesday morning saw S&P 500 futures edging higher as investors analysed the latest financial reports from corporate America.

Futures linked to the S&P500index rose by 0.26%, with Nasdaq 100 futures showing a more significant increase of 0.66%. Meanwhile, Dow Jones Industrial Average futures saw a modest uptick of 0.06%.

Tesla experienced a notable surge of over 13% in extended trading following the company's announcement of a renewed focus on "more affordable" electric vehicle models. However, despite its status as a mega cap tech favourite among retail investors, Tesla fell short of expectations on both revenue and earnings lines in its latest quarterly report.

Technical analysis

USA500 Analysis Technical analysis 24/04/2024
Time Frame: 1 hour

USA500 Support & Resistance Table - 24/04/2024

Support & Resistance Level Explanation
Resistance 2 5164.00 Daily R2
Resistance 1 5141.42 Daily R1
Support 1 5081.22 Daily S1
Support 2 5058.64 Daily S2

USA500 Indicator Table - 24/04/2024

Indicator Signal
SMA 20 Buy
SMA 50 Buy
SMA 100 Sell
MACD( 12;26;9) Sell
RSI (14) Sell
Stochastic ( 9;6;3) Sell

USA500 Indicator / Period Table - 24/04/2024

Indicator / Period Day - SellWeek - BuyMonth - Buy
MACD( 12;26;9) Sell BuyBuy
RSI (14) Sell BuyBuy
SMA 20 Buy BuyBuy

USA500 24/04/2024 - Reference Price : 5115.82

Sell
Simple Moving AverageBuy (2)Sell (1)
Technical Indicators - OscillatorsBuy (0)Sell (3)
Share It With Your Network
USA500 Chart
Update Time: -
Highest
Lowest
1M 5M H D W
Prices are loading..
Ready for trading?Start Now