77% of retail investor accounts lose money when trading CFDs with this provider.
CFDs are complex instruments and come with a high risk of losing money rapidly due to leverage. 77% of retail investor accounts lose money when trading CFDs with this provider. You should consider whether you understand how CFDs work and whether you can afford to take the high risk of losing your money.
76% of retail investor accounts lose money when trading CFDs with this provider.
CFDs are complex instruments and come with a high risk of losing money rapidly due to leverage. 76% of retail investor accounts lose money when trading CFDs with this provider. You should consider whether you can afford to take the high risk of losing your money.
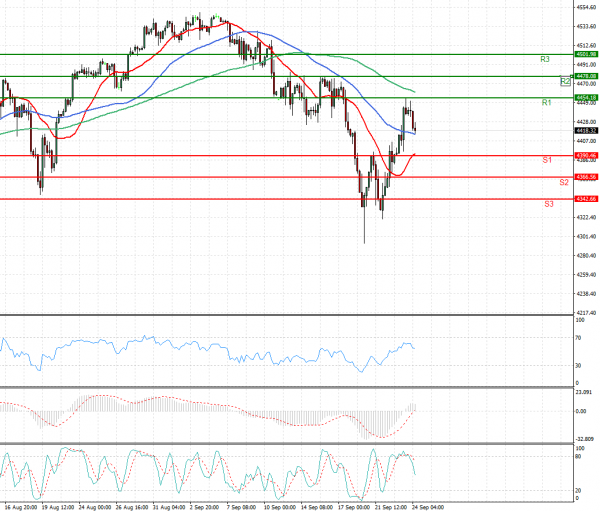
US Session Analysis for CFD Instruments 24/09/2021
Fundamental analysis
24 September, 2021
U.S. stock futures wavered and bond yields ticked up to multi-month highs, as uncertainty lingered about the future of heavily indebted property giant China Evergrande Group. Futures tied to blue-chip index and the broader S&P 500 both edged down 0.3% Friday. Technology-heavy Nasdaq-100 futures weakened 0.5%. On Thursday, all three indexes rebounded, paring losses from earlier in the week. Markets have been whipsawed this week by fears that the possible collapse of Evergrande could spill over into global markets and add to an already darkening outlook for global growth. Evergrande inched closer to a potential default Friday as a deadline on a key interest payment to its U.S. dollar bondholders passed without any announcement.