The Aussie Dollar currency pair fell, moving to around 0.7235 levels during the Asian session. The Aussie Dollar inched higher ahead of Wednesday’s U.S. Federal Reserve decision on interest rates. Australia’s MI Leading Index fell 0.3%, Month-over-Month. In the United States, Existing Home Sales for August came in at 5.88 million, down 2.0%, Month-over-Month, and just below the 5.89 million analysts had forecast.
Australian Dollar - Dollar Analysis
EU Session Analysis for CFD Instruments 23/09/2021
Technical analysis
Time Frame: 1 hour
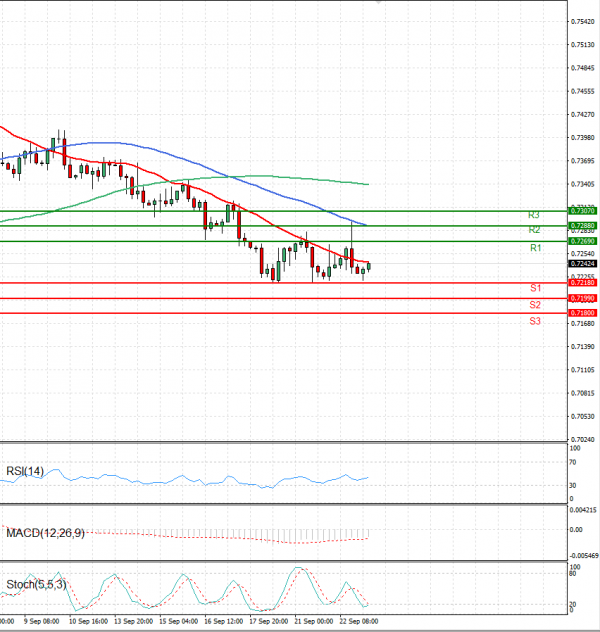
AUDUSD Support & Resistance Table - 23/09/2021
| Support & Resistance | Level | Explanation |
| Resistance 2 | 0.7288 | Daily R2 |
| Resistance 1 | 0.7269 | Daily R1 |
| Support 1 | 0.7218 | Daily S1 |
| Support 2 | 0.7199 | Daily S2 |
AUDUSD Indicator Table - 23/09/2021
| Indicator | Signal |
| SMA 20 | Sell |
| SMA 50 | Sell |
| SMA 100 | Sell |
| MACD( 12;26;9) | Sell |
| RSI (14) | Buy |
| Stochastic ( 9;6;3) | Buy |
AUDUSD Indicator / Period Table - 23/09/2021
| Indicator / Period | Day - Sell | Week - Sell | Month - Buy |
| MACD( 12;26;9) | Sell | Sell | Buy |
| RSI (14) | Buy | Sell | Neutral |
| SMA 20 | Sell | Sell | Buy |
AUDUSD 23/09/2021 - Reference Price : 0.7242
| Sell |
|
Ready for trading?Start Now