CFDs are complex instruments and come with a high risk of losing money rapidly due to leverage. 77% of retail investor accounts lose money when trading CFDs with this provider. You should consider whether you understand how CFDs work and whether you can afford to take the high risk of losing your money.
CFDs are complex instruments and come with a high risk of losing money rapidly due to leverage. 76% of retail investor accounts lose money when trading CFDs with this provider. You should consider whether you can afford to take the high risk of losing your money.

Crude Oil Analysis

EU Session Analysis for CFD Instruments 18/04/2024

Fundamental analysis

18 April, 2024

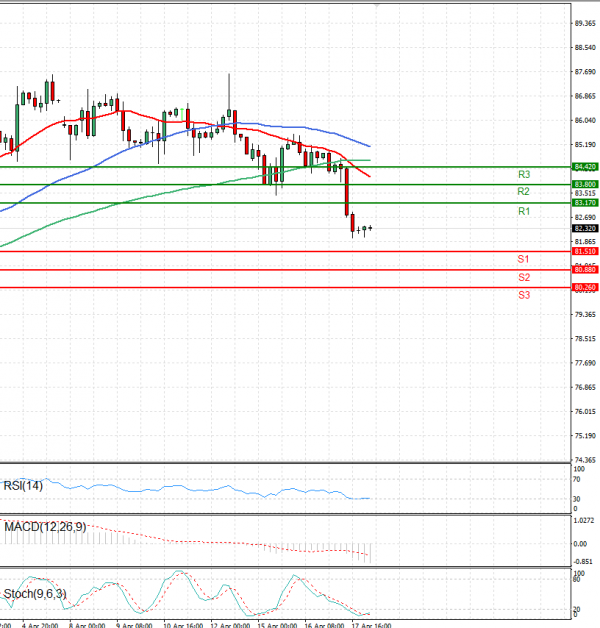
Crude Oil is trading today in the Asian session below the $83 level.

On Thursday, the US crude oil benchmark is trading near $82.25, slightly down for the day due to an increase in US crude inventory and expectations of delayed rate cuts from the Federal Reserve (Fed). However, escalating geopolitical tensions in the Middle East may limit further declines.

US crude oil stocks have risen for a fourth consecutive week. For the week ending April 12, crude oil stockpiles in the United States increased by 2.735 million barrels, compared to a build of 5.841 million barrels the previous week. The Energy Information Administration reported that the market consensus had anticipated a 1.6 million barrel increase.

Technical analysis

Crude Oil Analysis Technical analysis 18/04/2024
Time Frame: 1 hour

CRUDEOIL Support & Resistance Table - 18/04/2024

Support & Resistance Level Explanation
Resistance 2 83.80 Daily R2
Resistance 1 83.17 Daily R1
Support 1 81.51 Daily S1
Support 2 80.88 Daily S2

CRUDEOIL Indicator Table - 18/04/2024

Indicator Signal
SMA 20 Sell
SMA 50 Sell
SMA 100 Sell
MACD( 12;26;9) Sell
RSI (14) Neutral
Stochastic ( 9;6;3) Neutral

CRUDEOIL Indicator / Period Table - 18/04/2024

Indicator / Period Day - SellWeek - BuyMonth - Buy
MACD( 12;26;9) Sell BuyBuy
RSI (14) Neutral BuyNeutral
SMA 20 Sell BuyBuy

CRUDEOIL 18/04/2024 - Reference Price : 82.32

Sell
Simple Moving AverageBuy (0)Sell (3)
Technical Indicators - OscillatorsBuy (0)Sell (1)
Share It With Your Network
Crude OIL Chart
Update Time: -
Highest
Lowest
1M 5M H D W
Prices are loading..
Ready for trading?Start Now