CFDs are complex instruments and come with a high risk of losing money rapidly due to leverage. 77% of retail investor accounts lose money when trading CFDs with this provider. You should consider whether you understand how CFDs work and whether you can afford to take the high risk of losing your money.
CFDs are complex instruments and come with a high risk of losing money rapidly due to leverage. 76% of retail investor accounts lose money when trading CFDs with this provider. You should consider whether you can afford to take the high risk of losing your money.

Crude Oil Analysis

EU Session Analysis for CFD Instruments 20/04/2021

Fundamental analysis

20 April, 2021

Oil prices rose on Tuesday as a weaker U.S. dollar supported commodities and on expectations that crude inventories fell in the United States, the world’s biggest oil user, though rising coronavirus cases in Asia capped gains. The dollar index slumped to a six-week low against other major currencies on Monday following a plunge in U.S. Treasury yields last week and remained near the low at 91.055 on Tuesday. Also supporting prices, U.S. crude oil and distillate stockpiles were expected to have dropped last week, while gasoline inventories likely rose, a preliminary Reuters poll showed on Monday. The poll was conducted ahead of reports from industry group American Petroleum Institute (API) due on Tuesday and the Energy Information Administration (EIA), the statistical arm of the U.S. Department of Energy, on Wednesday. Libya’s National Oil Corp declared force majeure on Monday on exports from the port of Hariga and said it could extend the measure to other facilities because of a budget dispute with the country’s central bank. The disruption could cut Libya’s oil output by 280,000 barrels per day (bpd), knocking production below 1 million bpd for the first time since October, ING said.
Technical analysis

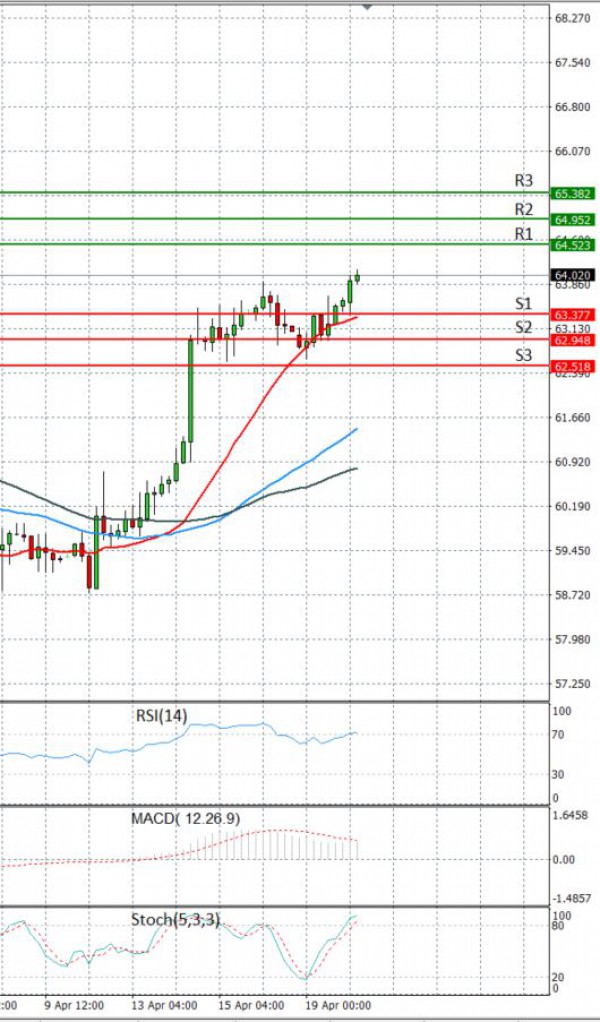
Crude Oil Analysis Technical analysis 20/04/2021
Time Frame: 1 hour

CRUDEOIL Support & Resistance Table - 20/04/2021

Support & Resistance Level Explanation
Resistance 2 64.952 Daily R2
Resistance 1 64.523 Daily R1
Support 1 63.377 Daily S1
Support 2 62.948 Daily S2

CRUDEOIL Indicator Table - 20/04/2021

Indicator Signal
SMA 20 Buy
SMA 50 Buy
SMA 100 Buy
MACD( 12;26;9) Buy
RSI (14) Buy
Stochastic ( 9;6;3) Buy

CRUDEOIL Indicator / Period Table - 20/04/2021

Indicator / Period Day - BuyWeek - BuyMonth - Buy
MACD( 12;26;9) Buy NeutralBuy
RSI (14) Buy BuyBuy
SMA 20 Buy BuyBuy

CRUDEOIL 20/04/2021 - Reference Price : 63.950

Buy
Simple Moving AverageBuy (3)Sell (0)
Technical Indicators - OscillatorsBuy (3)Sell (0)
Share It With Your Network
Crude OIL Chart
Update Time: -
Highest
Lowest
1M 5M H D W
Prices are loading..
Ready for trading?Start Now