CFDs are complex instruments and come with a high risk of losing money rapidly due to leverage. 77% of retail investor accounts lose money when trading CFDs with this provider. You should consider whether you understand how CFDs work and whether you can afford to take the high risk of losing your money.
CFDs are complex instruments and come with a high risk of losing money rapidly due to leverage. 76% of retail investor accounts lose money when trading CFDs with this provider. You should consider whether you can afford to take the high risk of losing your money.

Gold - Usd Dollar Analysis

EU Session Analysis for CFD Instruments 23/04/2024

Fundamental analysis

23 April, 2024

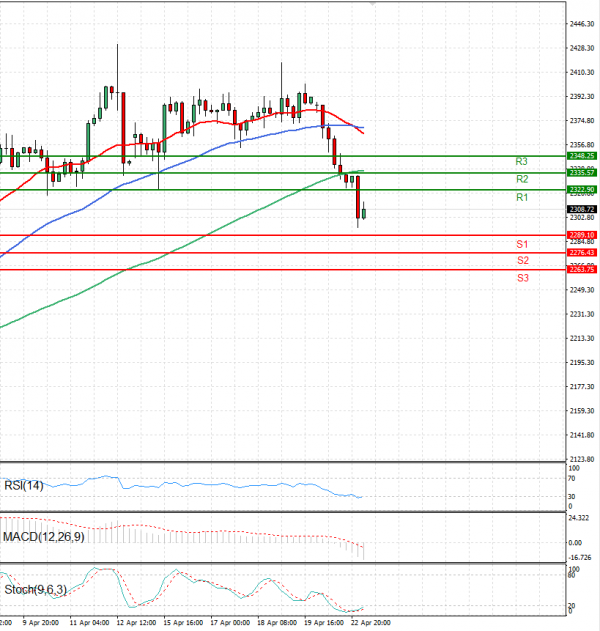
Gold prices are trading in today’s Asian session above 2330 levels.

Gold took a sharp nosedive during Asian trading on Tuesday, registering its most significant intraday drop in almost two years.

This decline came as tensions in the Middle East eased, reducing the demand for safe-haven investments. The previous week had seen heightened concerns about a potential full-scale conflict between Israel and Iran.

However, as this week began, there were indications of a de-escalation. Nasser Kanaani, a spokesperson for Iran's Foreign Ministry, played down the effects of Israel's attacks during a speech in Tehran on Monday, indicating that Israel had already faced a suitable response.

Technical analysis

Gold - Usd Dollar Analysis Technical analysis 23/04/2024
Time Frame: 1 hour

GOLD Support & Resistance Table - 23/04/2024

Support & Resistance Level Explanation
Resistance 2 2335.57 Daily R2
Resistance 1 2322.90 Daily R1
Support 1 2289.10 Daily S1
Support 2 2276.43 Daily S2

GOLD Indicator Table - 23/04/2024

Indicator Signal
SMA 20 Sell
SMA 50 Sell
SMA 100 Sell
MACD( 12;26;9) Sell
RSI (14) Buy
Stochastic ( 9;6;3) Buy

GOLD Indicator / Period Table - 23/04/2024

Indicator / Period Day - SellWeek - BuyMonth - Buy
MACD( 12;26;9) Sell BuyBuy
RSI (14) Buy BuyBuy
SMA 20 Sell BuyBuy

GOLD 23/04/2024 - Reference Price : 2308.72

Sell
Simple Moving AverageBuy (0)Sell (3)
Technical Indicators - OscillatorsBuy (2)Sell (1)
Share It With Your Network
GOLD Chart
Update Time: -
Highest
Lowest
1M 5M H D W
Prices are loading..
Ready for trading?Start Now