77% of retail investor accounts lose money when trading CFDs with this provider.
CFDs are complex instruments and come with a high risk of losing money rapidly due to leverage. 77% of retail investor accounts lose money when trading CFDs with this provider. You should consider whether you understand how CFDs work and whether you can afford to take the high risk of losing your money.
76% of retail investor accounts lose money when trading CFDs with this provider.
CFDs are complex instruments and come with a high risk of losing money rapidly due to leverage. 76% of retail investor accounts lose money when trading CFDs with this provider. You should consider whether you can afford to take the high risk of losing your money.
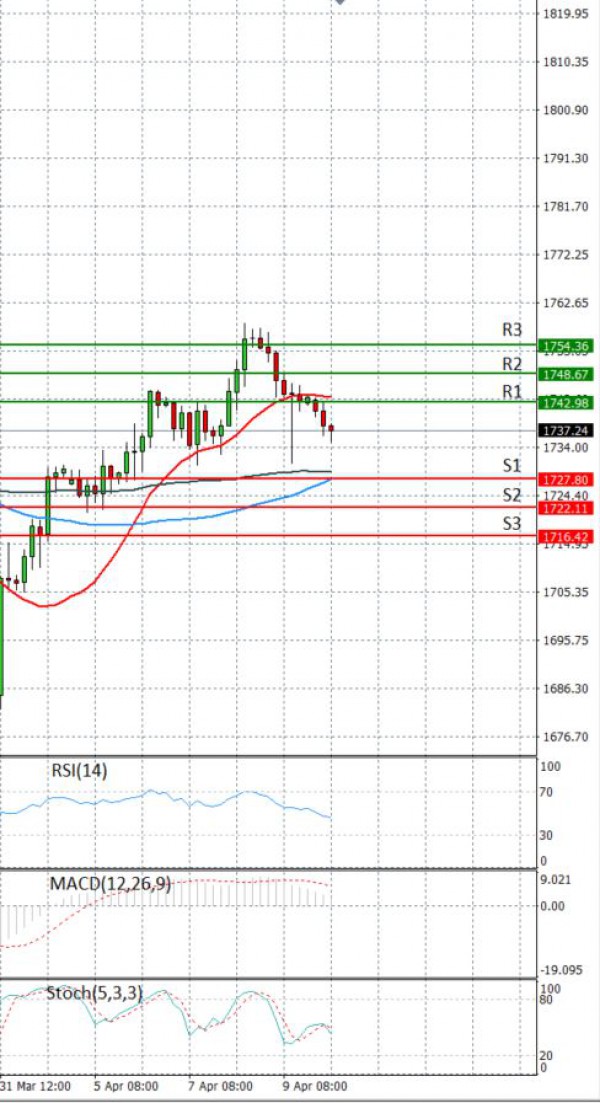
EU Session Analysis for CFD Instruments 12/04/2021
Fundamental analysis
12 April, 2021
Gold prices fell on Monday, weighed down by surging U.S. Treasury yields and a firmer dollar after better-than-expected U.S. economic data lifted prospects for higher inflation. Producer prices in the United States rose more than anticipated in March, resulting in the highest annual rise in 9-1/2 years and signalling the start of higher inflation as the economy reopens amid strengthened public health and substantial government assistance. Some investors view gold as a hedge against higher inflation, but higher Treasury yields dull some of the appeal of the non-yielding metal. Federal Reserve Chair Jerome Powell said the U.S. economy is at an "inflection point," with hopes that inflation and hiring will accelerate in the coming months, but there are dangers if a hasty reopening leads to a continuing uptick in coronavirus cases.