CFDs are complex instruments and come with a high risk of losing money rapidly due to leverage. 77% of retail investor accounts lose money when trading CFDs with this provider. You should consider whether you understand how CFDs work and whether you can afford to take the high risk of losing your money.
CFDs are complex instruments and come with a high risk of losing money rapidly due to leverage. 76% of retail investor accounts lose money when trading CFDs with this provider. You should consider whether you can afford to take the high risk of losing your money.

USA500 Analysis

EU Session Analysis for CFD Instruments 19/04/2024

Fundamental analysis

19 April, 2024

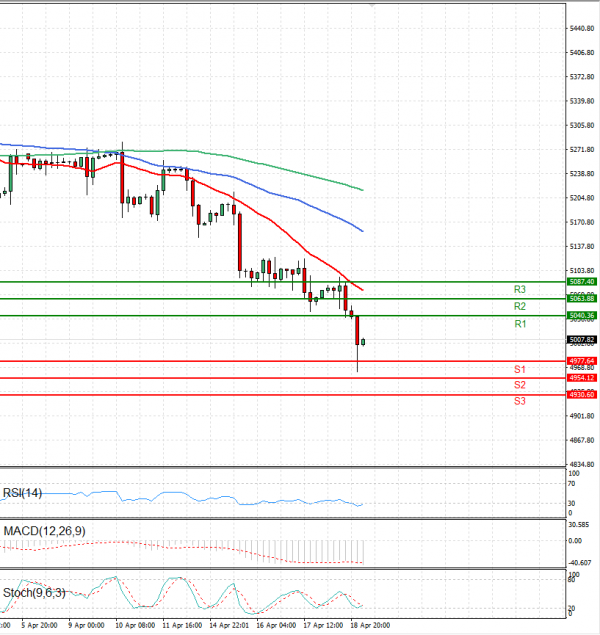
The USA500 is currently trading below 5,000 levels.

U.S. stock index futures declined during evening trading on Thursday due to hawkish remarks from Federal Reserve officials, intensifying worries about prolonged higher interest rates.

This week, several Fed officials cautioned that persistent inflationary pressures would provide little motivation for the central bank to initiate interest rate cuts in early 2024. Their statements coincided with ongoing indicators of robust economic performance in the U.S., providing further leeway for the Fed to maintain elevated interest rates.

S&P 500 Futures dropped by 0.2%, Nasdaq 100 Futures by 0.4%, and Dow Jones Futures by 0.2%.

Technical analysis

USA500 Analysis Technical analysis 19/04/2024
Time Frame: 1 hour

USA500 Support & Resistance Table - 19/04/2024

Support & Resistance Level Explanation
Resistance 2 5063.88 Daily R2
Resistance 1 5040.36 Daily R1
Support 1 4977.64 Daily S1
Support 2 4954.12 Daily S2

USA500 Indicator Table - 19/04/2024

Indicator Signal
SMA 20 Sell
SMA 50 Sell
SMA 100 Sell
MACD( 12;26;9) Sell
RSI (14) Buy
Stochastic ( 9;6;3) Buy

USA500 Indicator / Period Table - 19/04/2024

Indicator / Period Day - SellWeek - BuyMonth - Buy
MACD( 12;26;9) Sell BuyBuy
RSI (14) Buy BuyBuy
SMA 20 Sell BuyBuy

USA500 19/04/2024 - Reference Price : 5007.82

Sell
Simple Moving AverageBuy (0)Sell (3)
Technical Indicators - OscillatorsBuy (2)Sell (1)
Share It With Your Network
USA500 Chart
Update Time: -
Highest
Lowest
1M 5M H D W
Prices are loading..
Ready for trading?Start Now