CFDs are complex instruments and come with a high risk of losing money rapidly due to leverage. 77% of retail investor accounts lose money when trading CFDs with this provider. You should consider whether you understand how CFDs work and whether you can afford to take the high risk of losing your money.
CFDs are complex instruments and come with a high risk of losing money rapidly due to leverage. 76% of retail investor accounts lose money when trading CFDs with this provider. You should consider whether you can afford to take the high risk of losing your money.

USA500 Analysis

EU Session Analysis for CFD Instruments 24/04/2024

Fundamental analysis

24 April, 2024

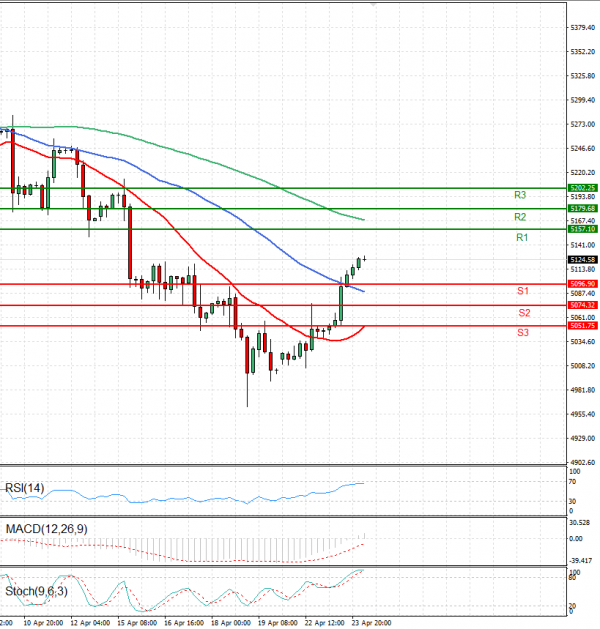
The USA500 is currently trading above 5,000 levels.

In the evening trading session on Tuesday, U.S. stock index futures climbed, continuing the upward trend seen on Wall Street, particularly driven by a rebound in technology shares in anticipation of upcoming key earnings reports.

Tesla stood out as one of the top performers in after-hours trading following its announcement of plans to introduce new models, particularly affordable electric vehicles by 2025, which overshadowed disappointing first-quarter earnings.

S&P 500 Futures edged up by 0.15%, while Nasdaq 100 Futures gained 0.4%. Meanwhile, Dow Jones Futures remained steady.

Technical analysis

USA500 Analysis Technical analysis 24/04/2024
Time Frame: 1 hour

USA500 Support & Resistance Table - 24/04/2024

Support & Resistance Level Explanation
Resistance 2 5179.68 Daily R2
Resistance 1 5157.10 Daily R1
Support 1 5096.90 Daily S1
Support 2 5074.32 Daily S2

USA500 Indicator Table - 24/04/2024

Indicator Signal
SMA 20 Buy
SMA 50 Buy
SMA 100 Sell
MACD( 12;26;9) Sell
RSI (14) Buy
Stochastic ( 9;6;3) Buy

USA500 Indicator / Period Table - 24/04/2024

Indicator / Period Day - BuyWeek - BuyMonth - Buy
MACD( 12;26;9) Sell BuyBuy
RSI (14) Buy BuyBuy
SMA 20 Buy BuyBuy

USA500 24/04/2024 - Reference Price : 5124.58

Buy
Simple Moving AverageBuy (2)Sell (1)
Technical Indicators - OscillatorsBuy (2)Sell (1)
Share It With Your Network
USA500 Chart
Update Time: -
Highest
Lowest
1M 5M H D W
Prices are loading..
Ready for trading?Start Now