CFDs are complex instruments and come with a high risk of losing money rapidly due to leverage. 77% of retail investor accounts lose money when trading CFDs with this provider. You should consider whether you understand how CFDs work and whether you can afford to take the high risk of losing your money.
CFDs are complex instruments and come with a high risk of losing money rapidly due to leverage. 76% of retail investor accounts lose money when trading CFDs with this provider. You should consider whether you can afford to take the high risk of losing your money.

USA500 Analysis

EU Session Analysis for CFD Instruments 20/04/2021

Fundamental analysis

20 April, 2021

U.S. stocks closed lower on Monday, slipping from last week’s record levels, as investors awaited guidance from first-quarter earnings to justify high valuations, while Tesla Inc shares fell after a fatal car crash. The electric-car maker slid 3.4% after a Tesla vehicle believed to be operating without anyone in the driver’s seat crashed into a tree on Saturday north of Houston, killing two occupants. The S&P 500 was mostly lower, with Microsoft Corp, Amazon.com Inc and Nvidia Corp also weighing on the benchmark index as analysts await results this week and next that form the bulk of earnings season. Corporate outlooks should indicate to what degree the rally from last year’s lows can continue. Analysts expect first-quarter earnings to have grown 30.9% from a year ago, according to Refinitiv IBES data. Coca-Cola Co rose 0.6% after the beverage maker easily beat estimates for quarterly profit and revenue, benefiting from the easing of pandemic curbs and wide vaccine rollouts.
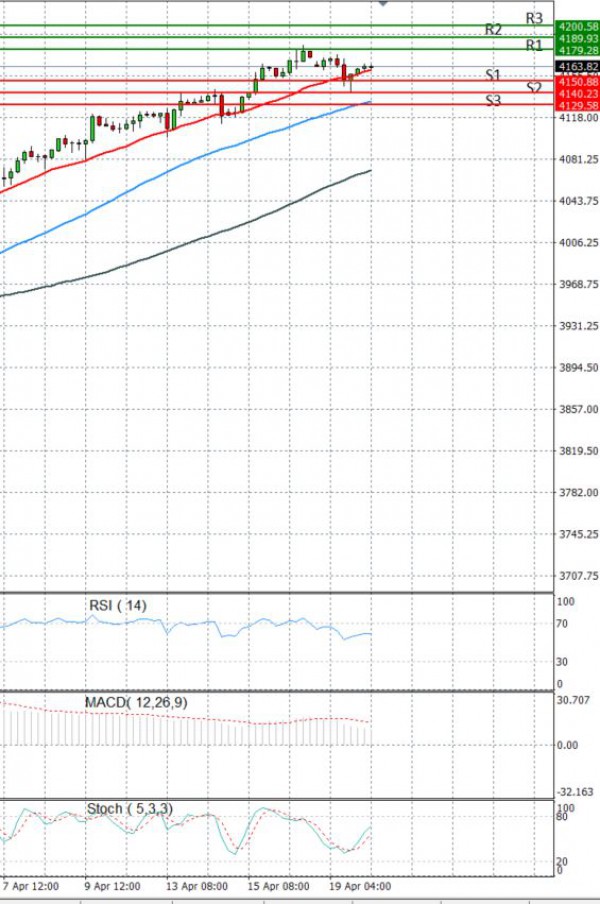
Technical analysis

USA500 Analysis Technical analysis 20/04/2021
Time Frame: 1 hour

USA500 Support & Resistance Table - 20/04/2021

Support & Resistance Level Explanation
Resistance 2 4189.93 Daily R2
Resistance 1 4179.28 Daily R1
Support 1 4150.88 Daily S1
Support 2 4140.23 Daily S2

USA500 Indicator Table - 20/04/2021

Indicator Signal
SMA 20 Neutral
SMA 50 Buy
SMA 100 Buy
MACD( 12;26;9) Buy
RSI (14) Buy
Stochastic ( 9;6;3) Buy

USA500 Indicator / Period Table - 20/04/2021

Indicator / Period Day - BuyWeek - BuyMonth - Buy
MACD( 12;26;9) Buy BuyBuy
RSI (14) Buy BuyBuy
SMA 20 Neutral BuyBuy

USA500 20/04/2021 - Reference Price : 4165.08

Buy
Simple Moving AverageBuy (2)Sell (0)
Technical Indicators - OscillatorsBuy (3)Sell (0)
Share It With Your Network
USA500 Chart
Update Time: -
Highest
Lowest
1M 5M H D W
Prices are loading..
Ready for trading?Start Now