CFDs are complex instruments and come with a high risk of losing money rapidly due to leverage. 77% of retail investor accounts lose money when trading CFDs with this provider. You should consider whether you understand how CFDs work and whether you can afford to take the high risk of losing your money.
CFDs are complex instruments and come with a high risk of losing money rapidly due to leverage. 76% of retail investor accounts lose money when trading CFDs with this provider. You should consider whether you can afford to take the high risk of losing your money.

USA500 Analysis

EU Session Analysis for CFD Instruments 17/01/2022

Fundamental analysis

17 January, 2022

Major bank stocks declined after their earnings reports on Friday, weighing on the U.S. markets as Wall Street notched a second straight negative week to start the year. Bank stocks, which had outperformed in recent weeks as interest rates moved higher, were broadly lower as their reports appeared to underwhelm investors despite strong headline numbers. JPMorgan Chase, the No. 1 U.S. bank by assets, showed profit and revenue that topped estimates, but shares fell more than 6%. The company’s earnings were helped by a large credit reserve release, and CFO Jeremy Barnum warned that the company would likely miss a key profit target in the next two years. Citigroup’s stock fell nearly 1.3% after the bank beat revenue estimates but showed a 26% decline in profits. Shares of Morgan Stanley and Goldman Sachs, which report next week, also declined. Shares of Netflix jumped more than 1% after announcing a price increase for U.S. and Canadian subscribers, helping the Nasdaq outperform on Friday. On the data front, retail sales were down 1.9% in December, a worse reading than the 0.1% drop expected by economists surveyed by Dow Jones.
Technical analysis

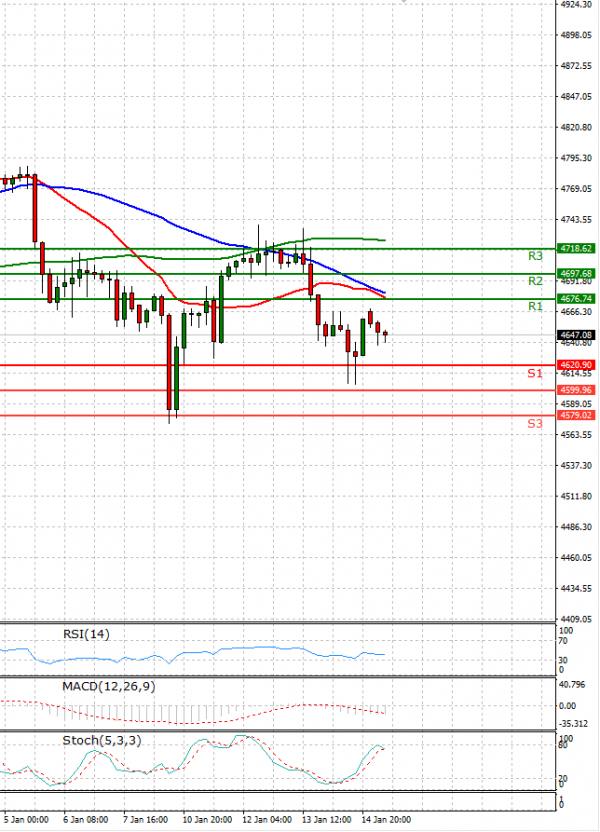
USA500 Analysis Technical analysis 17/01/2022
Time Frame: 1 hour

USA500 Support & Resistance Table - 17/01/2022

Support & Resistance Level Explanation
Resistance 2 4697.68 Daily R2
Resistance 1 4676.74 Daily R1
Support 1 4620.90 Daily S1
Support 2 4599.96 Daily S2

USA500 Indicator Table - 17/01/2022

Indicator Signal
SMA 20 Sell
SMA 50 Sell
SMA 100 Sell
MACD( 12;26;9) Sell
RSI (14) Sell
Stochastic ( 9;6;3) Sell

USA500 Indicator / Period Table - 17/01/2022

Indicator / Period Day - SellWeek - BuyMonth - Buy
MACD( 12;26;9) Sell BuyBuy
RSI (14) Sell BuyBuy
SMA 20 Sell SellBuy

USA500 17/01/2022 - Reference Price : 4648.82

Sell
Simple Moving AverageBuy (0)Sell (3)
Technical Indicators - OscillatorsBuy (0)Sell (3)
Share It With Your Network
USA500 Chart
Update Time: -
Highest
Lowest
1M 5M H D W
Prices are loading..
Ready for trading?Start Now