Natural Gas weekly special report based on 1.00 Lot Calculation:
TECHNICAL ANALYSIS:
- SUPPORT AREA $3.30 AND $3.00: Natural Gas has maintained short-term support in the area near the $3.00 mark, as shown by the daily chart below. However, there remains a risk of a potential breakout below this level if market conditions change.
- DAILY MOVING AVERAGES POINT TO UPTREND: Natural Gas prices have recently traded above the 20- and 50-day moving Averages, pointing to an ongoing uptrend. However, natural gas prices can also change their trend if prices fall below the 20- and 50-day Moving Averages.
- 14- DAY RELATIVE STRENGTH INDEX (RSI) STAYS ABOVE 50: The chart below shows that the 14- day relative strength index (RSI) remains in an uptrend, floating above the break-even point of 50, towards the upper limit of 70, before it tries to enter an oversold territory and potentially change its trend.
- LONGER-TERM TREND LINE: The black trend line depicted by the chart below shows that Natural Gas prices have maintained their uptrend in general since July 2024.
- RESISTANCE AND SUPPORT LEVELS: Natural gas has remained in a short-term uptrend, looking at Resistance 1 of $3.950, Resistance 2 of $4.200, and Resistance 3 of $4.400 to the upside. On the downside, Natural Gas looks at Support 1 of $3.450, then towards Support 2 of $3.300, and Support 3 of $3.200.
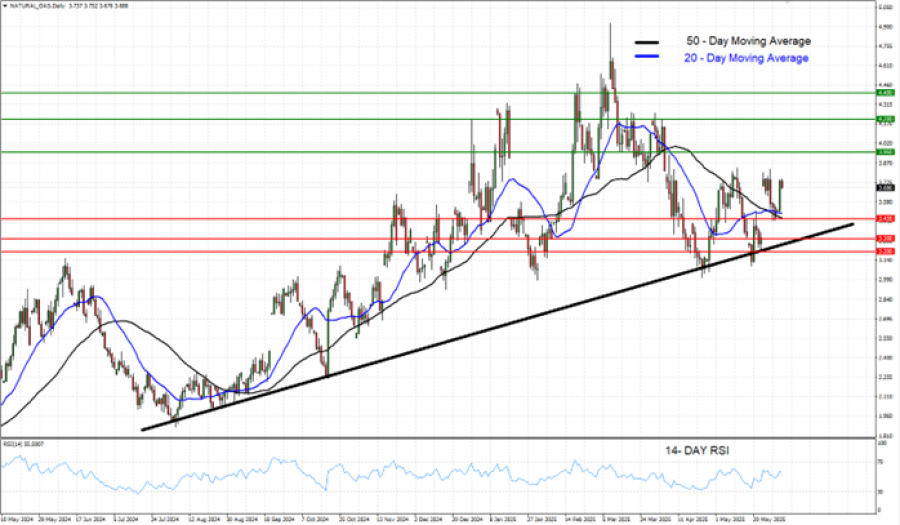
GRAPH (Daily): July 2024 – June 2025
Please note that past performance does not guarantee future results
GEOPOLITICS:
- RUSSIA – UKRAINE POTENTIAL PEACE AGREEMENT IN JEOPARDY AS NO PROGRESS ANNOUNCED AFTER TALKS ON JUNE 2. Uncertainties remain high after Monday’s (June 2) talks in Turkey and all that even after President Trump- President Putin phone call that took place on May 19. The phone call happened after another round of unsuccessful talks between Russia and Ukraine in Istanbul, Turkey on May 16, where there were no signs of a major breakthrough, neither.
- US – IRAN NUCLEAR TALKS: MIDDLE EAST TENSIONS RISE AS NO CONCRETE DEALS HAVE BEEN MADE BETWEEN THE USA AND IRAN. The latest round of talks between the US and Iran in Rome, Italy brought no concrete agreements. Iran is still insisting on continuing its uranium enrichment program, while USA wants zero uranium enrichment from Iran. The next and sixth round of talks is expected to take place sometime in June.
GLOBAL TRADE:
- EVENT (EXPECTED: THIS MONTH): US PRESIDENT DONALD TRUMP TO SPEAK WITH CHINA PRESIDENT XI. President Trump is expected to speak with China’s President Xi this week, a White House official told CNBC, amid tensions that could jeopardize a tentative trade deal.
- BREAKING (MAY 12): U.S. AND CHINA ANNOUNCED A TARIFF RELIEF FOR 90 DAYS: U.S. and China have reduced tariffs, 145% to 30% (U.S.) and 125% to 10% (China). The deal may boost oil demand by easing trade and stimulating China’s economy, which is likely to drive higher usage of oil, supporting global prices.
EVENTS:
- THURSDAY, JUNE 5 AT 15:30 GMT+1: ENERGY INFORMATION ADMINISTRATION (EIA) NATURAL GAS INVENTORY DATA (USA). If data showed a declining inventory for the past week, then positive support for the natural gas price could be expected. However, the price could decline.
Natural Gas, June 3, 2025
Current Price: 3.680
|
Natural Gas |
Weekly |
|
Trend direction |
|
|
4.400 |
|
|
4.200 |
|
|
3.950 |
|
|
3.450 |
|
|
3.300 |
|
|
3.200 |
Example of calculation based on weekly trend direction for 1.00 Lot1
|
Natural Gas |
||||||
|
Pivot Points |
||||||
|
Profit or loss in $ |
7,200 |
5,200 |
2,700 |
-2,300 |
-3,800 |
-4,800 |
|
Profit or loss in €² |
6,316 |
4,561 |
2,368 |
-2,018 |
-3,333 |
-4,211 |
|
Profit or loss in £² |
5,333 |
3,852 |
2,000 |
-1,704 |
-2,815 |
-3,556 |
|
Profit or loss in C$² |
9,887 |
7,141 |
3,708 |
-3,158 |
-5,218 |
-6,592 |
- 1.00 lot is equivalent of 10,000 units
- Calculations for exchange rate used as of 12:30 (GMT+1) 03/06/2025
There is a possibility to use Stop-Loss and Take-Profit.
- You may wish to consider closing your position in profit, even if it is lower than the suggested one.
- Trailing stop techniques could protect the profit.