Palladium weekly special report based on 1.00 Lot Calculation:
PALLADIUM USE AND MARKET SHARE:
- Palladium is mostly used in catalytic converters by the car industry to reduce harmful gas emissions, while tightening regulations are forcing automakers to put more Palladium into each vehicle, which in turn could keep the demand outlook positive. Palladium has also been used in fuel cells to generate power.
- MARKET SHARE (PRODUCERS): Russia is the largest producer, holding 43% of the market, while South Africa is the second largest with 33.00% of the market. Canada is third on the list with 9.5% of the global production.
- MARKET SHARE (CONSUMERS): China is the largest Palladium consumer with 31%, while Europe and North America (USA) hold 20% each. Japan stands at 11%.
TECHNICAL ANALYSIS:
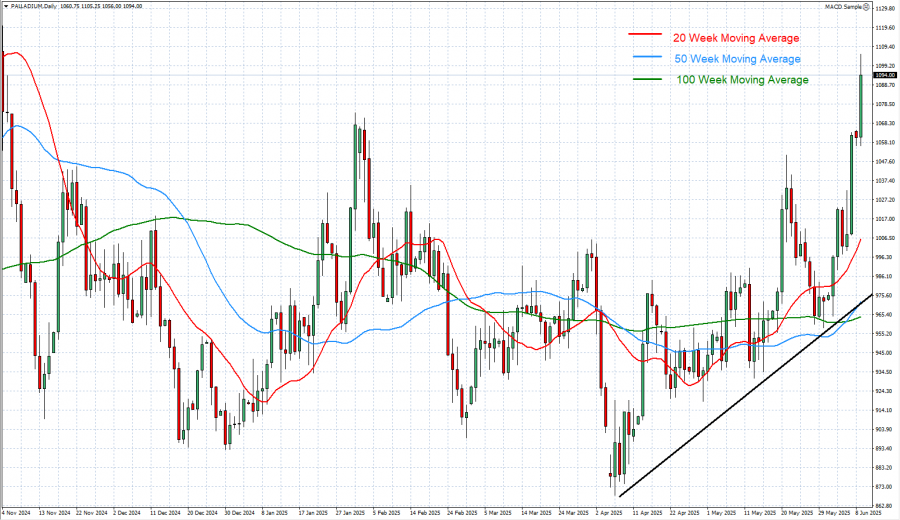
- CURRENT UPTREND: The black trend line, describing the uptrend, is depicted on the chart below. Palladium has tested a level of $900 in April, and since then it has been moving in this uptrend channel. However, there remains a risk of a potential breakout below this level if market conditions change.
- DAILY MOVING AVERAGES POINT TO UPTREND: Palladium prices have recently traded above the 20-, 50-, and 100-Daily Moving Averages, pointing to an ongoing uptrend. However, Palladium prices can also change their trend if prices fall below the 20-, 50-, and 100-Daily Moving Averages.
- PALLADIUM HIT AN ALL-TIME HIGH OF $3,409 (MARCH 2022). Palladium trades around $1,090, and if the price of Palladium moves to the level of $3,409, this would be around 212% of a price change. However, the price could decline.
GRAPH (Daily): November 2024 – June 2025
Please note that past performance does not guarantee future results
EVENTS (GEOPOLITICS):
- MONDAY, JUNE 9: US AND CHINA TRADE TALKS BEGIN IN LONDON, UK: High-level trade negotiations between the US and China could support palladium prices if progress is made, as improved relations could boost global economic confidence and industrial demand—especially from China, a key consumer of palladium in the automotive sector.
EVENTS (USA):
- WEDNESDAY, JUNE 11 AT 13:30 GMT+1: US INFLATION (CPI) (MAY): A lower-than-expected CPI reading could support palladium prices by increasing the possibility of Fed rate cuts. Looser monetary policy could weaken the US dollar and stimulate economic activity, boosting demand for industrial metals like palladium.
EVENTS (CHINA):
- MONDAY, JUNE 16 AT 03:00 GMT+1: CHINA INDUSTRIAL PRODUCTION (JUNE): Stronger-than-expected industrial production could lift palladium prices, as it would indicate rising manufacturing and automotive activity, key sources of palladium demand. As the world’s top car producer, China’s industrial output is closely tied to palladium consumption. (PREVIOUS: +6.1%)
PALLADIUM, June 9, 2025
Current Price: 1090
|
PALLADIUM |
Weekly |
|
Trend direction |
|
|
1,250 |
|
|
1,200 |
|
|
1,160 |
|
|
1,030 |
|
|
1,020 |
|
|
1,000 |
Example of calculation base on weekly trend direction for 1.00 Lot1
PALLADIUM
|
Pivot Points |
||||||
|
Profit or loss in $ |
16,000 |
11,000 |
7,000 |
-6,000 |
-7,000 |
-9,000 |
|
Profit or loss in €2 |
14,008 |
9,630 |
6,128 |
-5,253 |
-6,128 |
-7,879 |
|
Profit or loss in £2 |
11,793 |
8,108 |
5,160 |
-4,422 |
-5,160 |
-6,634 |
|
Profit or loss in C$2 |
21,886 |
15,047 |
9,575 |
-8,207 |
-9,575 |
-12,311 |
- 1.00 lot is equivalent of 100 units
- Calculations for exchange rate used as of 09:50 (GMT+1) 9/6/2025
There is a possibility to use Stop-Loss and Take-Profit.
- You may wish to consider closing your position in profit, even if it is lower than suggested one.
- Trailing stop technique could protect the profit.