AMAZON (#AMAZON) weekly uptrend opportunity based On 1.00 Lot Calculation:
GLOBAL E-COMMERCE:
-
MARKET SIZE (EXPECTED: $5.55 trillion in 2022): The e-commerce (online sales) market is expected to total $5.55 trillion in 2022, accounting for 21% of total retail sales ($26.42 trillion). Two years ago only 17.8% of sales were made online.
-
MARKETS SIZE (EXPECTED: $7.3 TRILLION IN 2025, UP 30% FROM 2022): The global e-commerce market is forecast to be over $7.3 trillion in 2025, compared to 2021’s $4.921 trillion. E- commerce worldwide is expected to represent 24.5% of all global sales in 2025, up from 19.6% in 2021 and 17.8% in 2020.
-
MARKET SHARE BY COUNTRY: China is estimated to claim 52.1% of the global market, USA with 19%, UK with 4.8% and Japan with 3.0%. Rest of the world covers 21.1%.
-
MARKET SHARE BY COMPANY AND BY SALES: Alibaba (Taobao and Tmall) claimed 24.00%, while Amazon took up 13% of the global e- commerce market. JD.com claimed 9.20% of the market.
U.S. E-COMMERCE:
-
MARKET SIZE ($843 billion): The U.S. e-commerce market was $843.15 billion in 2021. The US market grew at 19.7% per year since 2017.
-
MARKET GROWTH POTENTIAL (OF TOTAL U.S. RETAIL SALES): U.S. E-COMMERCE MADE 13.2% IN 2021 OF TOTAL RETAIL SALES IN THE U.S. AND IT IS EXPECTED TO MAKE 22% BY 2025. By that time, sales could rise from $843.15 billion to $1.33 trillion.
-
MARKET SHARE: Amazon (41%), Walmart (6.6%), eBay (4.25%) and etc.
AMAZON (ANALYSIS AND EVENTS)
-
THE COMPANY: Amazon is the world’s largest online retailer by market capitalization (1.17 trillion dollars). It was founded by billionaire Jeff Bezos, one of the richest men in the world.
-
EVENT (STOCK SPLIT: 20 to 1): EFFECTIVE ON (MONDAY) JUNE 6, 2022. According to MarketWatch, investors view stock splits as a sign of confidence by management, because splits happen more often in stocks that have bullish momentum behind them. Splits also increase liquidity by making shares more accessible to a wider range of investors, something Amazon acknowledged when it announced its split.
STATISTICS: Since 1980, the shares of companies that do stock splits are typically up 25% a year later, compared to 9% for the broader market, according to a recent study by Bank of America.
RECENT STOCK SPLITS AND STOCK PERFORMANCE (SOURCES: YahooFinance, Bloomberg, Fortrade MT4):
Apple (STOCK SPILT: 7-1 effective June 9, 2014): 3 Months: +8.69%. 6 Months: +19.26%. 12 Months: +37.00%
Tesla (STOCK SPILT: 5-1 effective August 31, 2020): 3 Months: +28%. 6 Months: +53%. 12 Months: +65.91%
Apple (STOCK SPILT: 4-1 effective August 31, 2020): 3 Months: -4.5%. 6 Months: +2.11%. 12 Months: +22.00%
NVidia (STOCK SPILT: 4-1 effective July 20, 2021): 3 Months: +17.60%. 6 Months: +30%. 12 Months: /
*Please note that past performance does not guarantee future results -
RUMOUR: AMAZON COULD BE ADDED TO THE DOW JONES 30 INDEX. Amazon became a candidate to join the most important stock index in the US, the Dow Jones Industrial Index 30. Some analysts, including Wels Fargo say that they could be added together with Google, after Google’s stock split on July 18.
-
PRICE ACTION: THE STOCK HAS HAD A DOWNWARD CORRECTION OF AROUND 47.00% FROM ITS ALL- TIME HIGH OF 188.55. The stock has fallen to its lowest rate since the COVID pandemic, close to $100 (April 5, 2020). Amazon was last trading around 102, and If a full recovery follows to recent all- time highs, the stock could see an upside of around 85%.
-
ANALYST OPINION: Morgan Stanley forecasts $175. Deutsche Bank forecasts $174. Goldman Sachs forecasts $170. Credit Suisse forecasts $185. JPMorgan forecasts $200.
-
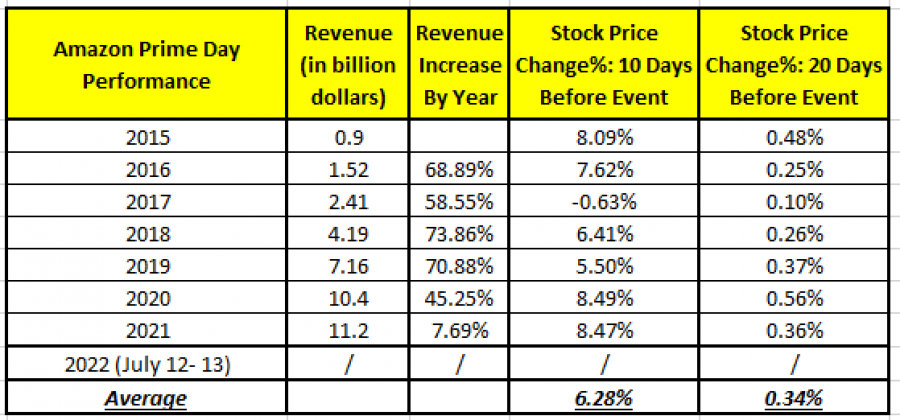
EVENT (AMAZON PRIME DAY): July 12- 13, 2022. Prime Day is Amazon’s exclusive sale that happens once a year. It involves only users who have an active Amazon Prime membership. Amazon offers thousands of products at a discount on Amazon Prime Day, and it typically serves as the company’s biggest day of the year in terms of revenue, generating even more sales than on Black Friday and Cyber Monday.
STATISTICS: In 2021, sales during the event reached a new record high, amounting to $11.2 billion, while the Black Friday sales in 2021 came in at $8.9 billion. According to statistics, since Amazon started organizing the AMAZON PRIME DAY in 2015, the Amazon stock has gone up 20 days and 10 days before the event on average by 0.34% and 6.28%, respectively.
Data Source I: YahooFinance
Data Source II: Statista
*Please note that past performance does not guarantee future results
AMAZON (#AMAZON), June 20, 2022
Current Price: 102.00
|
AMAZON |
Weekly |
|
Trend direction |
|
|
188.55 |
|
|
155.00 |
|
|
125.00 |
|
|
80.00 |
|
|
70.00 |
|
|
60.00 |
Example of calculation base on weekly trend direction for 1.00 Lot1
|
AMAZON |
||||||
|
Pivot Points |
||||||
|
Profit or loss in $ |
8,655.00 |
5,300.00 |
2,300.00 |
-2,200.00 |
-3,200.00 |
-4,200.00 |
|
Profit or loss in €2 |
8,230.79 |
5,040.23 |
2,187.27 |
-2,092.17 |
-3,043.16 |
-3,994.14 |
|
Profit or loss in £2 |
7,060.58 |
4,323.64 |
1,876.30 |
-1,794.72 |
-2,610.50 |
-3,426.28 |
|
Profit or loss in C$2 |
11,248.04 |
6,887.88 |
2,989.08 |
-2,859.12 |
-4,158.72 |
-5,458.32 |
1. 1.00 lot is equivalent of 100 units
2. Calculations for exchange rate used as of 14:00 (GMT+1) 20/06/2022
Fortrade recommends the use of Stop-Loss and Take-Profit, please speak to your Client Manager regarding their use.
-
You may wish to consider closing your position in profit, even if it is lower than suggested one
-
Trailing stop technique can protect the profit – Ask your Client Manager for more detail