Gold weekly uptrend opportunity based On 1.00 Lot Calculation:
- EVENT: INFLATION DATA (Tuesday, September 13th, 13:30 GMT+1): The United States will report its Consumer Price Index for August. July’s top line CPI came in at 8.5%, Year-over-Year, and its Core CPI was reported to be 5.9% Year-over-Year. These figures are historically high. Gold has been considered a hedge against high inflation for 6,000 years.
- GEO-POLITICAL EVENTS: The war in Ukraine has entered its 7th month. Tensions remain elevated between China and Taiwan. Civil unrest is picking up in Libya. Gold is considered to be a safe-haven asset and a preferred holding in times of global uncertainties.
- THE US ECONOMY HAS OFFICIALLY ENTERED A RECESSION. The United States GDP printed at -0.6% for its 2nd Quarter. This was the second consecutive negative GDP report, after Q1’s -1.6%, indicating the United States is in a recession.
- STATISTICS ON GOLD PERFORMANCE DURING AN ECONOMIC RECESSION: According to SuisseGold, there have been 8 recessions since 1976 (since the US dropped the gold standard). Historically, Gold tends to rise on average by 7.89% during an economic recession.
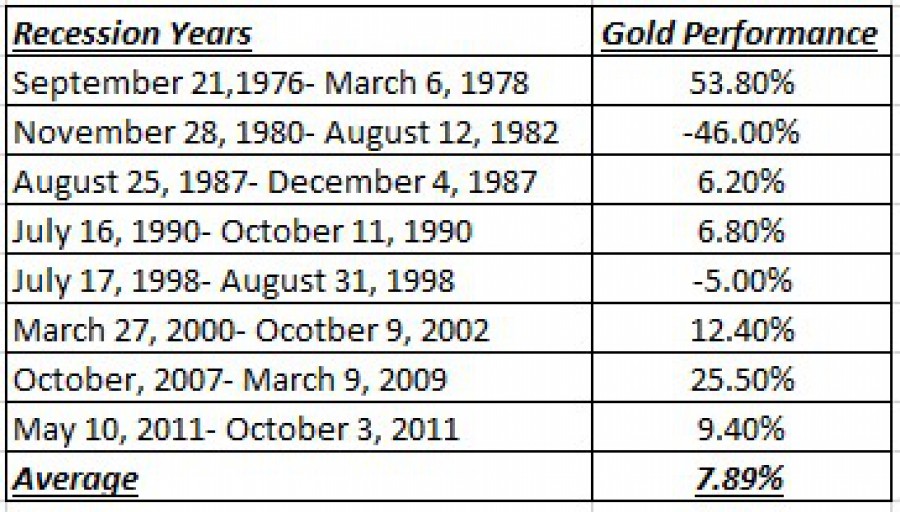
SOURCE: SuisseGold
Please note that past performance does not guarantee future results.
- GOLD PRICE ACTION: Gold reached $2070.06 in 2022. Gold has fallen ever since by around 19%, to test its lowest rate since August 2021 ($1680.57).
- TECHNICAL ANALYSIS: STRONG SUPPORT AT $1700. Since May 2020, Gold has held above $1700, trying to breach below that level only six times. Every time it tests levels below $1700, it would immediately return above that level, confirming a strong support area below $1700.
- ANALYSTS OPINION: Goldman Sachs six month price target to $1950. Citigroup forecasts $1900. Commerzbank expects $1900 by the end of 2022.
GOLD, September 5, 2022
Current Price: 1,710.00
|
Gold |
Weekly |
|
Trend direction |
|
|
1,850.00 |
|
|
1,800.00 |
|
|
1,760.00 |
|
|
1,670.00 |
|
|
1,635.00 |
|
|
1,600.00 |
Example of calculation base on weekly trend direction for 1.00 Lot1
|
Pivot Points |
||||||
|
Profit or loss in $ |
14,000.00 |
9,000.00 |
5,000.00 |
-4,000.00 |
-7,500.00 |
-11,000.00 |
|
Profit or loss in €2 |
14,127.29 |
9,081.83 |
5,045.46 |
-4,036.37 |
-7,568.19 |
-11,100.01 |
|
Profit or loss in £2 |
12,204.26 |
7,845.60 |
4,358.67 |
-3,486.93 |
-6,538.00 |
-9,589.06 |
|
Profit or loss in C$2 |
18,361.28 |
11,803.68 |
6,557.60 |
-5,246.08 |
-9,836.40 |
-14,426.72 |
1. 1.00 lot is equivalent of 100 units
2. Calculations for exchange rate used as of 08:05 (GMT+1) 05/09/2022
Fortrade recommends the use of Stop-Loss and Take-Profit, please speak to your Client Manager regarding their use.
- You may wish to consider closing your position in profit, even if it is lower than suggested one.
- Trailing stop technique can protect the profit – Ask your Client Manager for more details.