GOLD
November 2, 2026
Risk Disclaimer: The example below is for illustrative purposes only and is based on price movements derived from Contracts for Difference (CFDs). The calculations reflect hypothetical outcomes using historical or specified price data for the relevant instrument on the stated date and are not indicative of future performance. Any reliance placed on this material is strictly at the user’s own risk.
Weekly Special Report: Gold
TECHNICAL ANALYSIS:
GOLD: OCTOBER 2025 – NOVEMBER 2026 PRICE REVIEW
- GOLD PRICE TESTED LEVELS BELOW $4000: 7 times between October 2025 and November 2026. On October 30, gold tested levels below $4,000 for the eighth time.
- AVERAGE PRICE LOW: $3,959.45.
- AVERAGE PRICE HIGH: $4,291.10.
- AVERAGE TIME TO RECOVER FROM LOW TO HIGH: 14.1 days
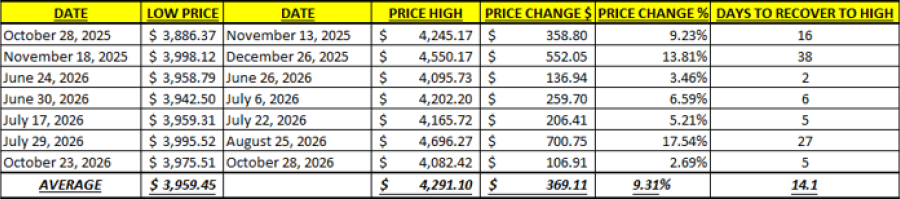
Data Source: MetaTrader 4
Please note that past performance does not guarantee future results
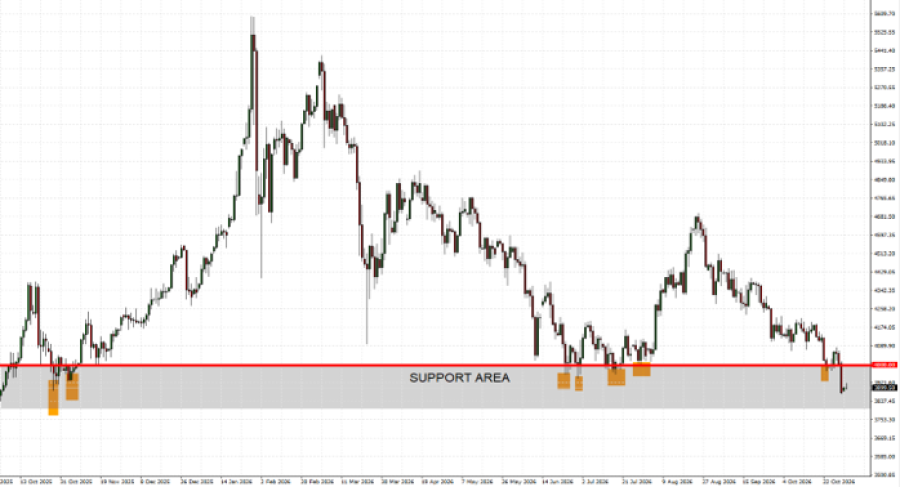
GRAPH (Daily): October 2025 – November 2026
Please note that past performance does not guarantee future results
U.S. MIDTERM ELECTIONS:
- U.S. MIDTERM ELECTIONS: NOVEMBER 3, 2026. Americans will elect all 435 House members and 35 senators, determining control of Congress for the next two years. Republicans currently hold majorities in both chambers under President Donald Trump.
- GOLD HAS HISTORICALLY PERFORMED STRONGLY DURING U.S. ELECTION YEARS. Since 2000, gold has risen in 10 of 13 election years, with an average gain of 11.1%. During midterm election years, gold gained in 4 of 6, averaging 11.8%. In election years involving Donald Trump (2016, 2018, 2020 and 2024), gold recorded an average gain of 14.72%.
EVENTS
- NOVEMBER 6 - 11: DIWALI FESTIVAL IN INDIA (MAIN CELEBRATION NOVEMBER 8). DIWALI is one of the most important Hindu festivals, celebrated in India and other countries. It symbolizes the victory of light over darkness and good over evil. Gold is traditionally purchased during Diwali.
ECONOMIC DATA
- FRIDAY, NOVEMBER 6, AT 13:30 GMT: U.S. NONFARM PAYROLLS AND UNEMPLOYMENT RATE (OCTOBER). Investors will closely watch the U.S. labor market after September’s weak employment data, when nonfarm payrolls (NFP) increased by just 29,000 vs. 89,000 expected. Another weak report could reduce expectations of another Federal Reserve interest rate hike, weighing on the U.S. dollar and supporting gold prices.
PRICE ACTION
- FORECAST: Wells Fargo forecasts $4,900; Bank of America forecasts $4,750; Goldman Sachs forecasts $4,900; Morgan Stanley forecasts $5,050; UBS forecasts $5,000; JPMorgan forecasts $4,500; Deutsche Bank forecasts $4,600; Citigroup forecasts $5,000; Societe General forecasts $5,000.
Gold, November 2, 2026
Current Price: 3,898
|
GOLD |
Weekly |
|
Market Trend |
|
|
4,100 |
|
|
4,050 |
|
|
4,000 |
|
|
3,800 |
|
|
3,775 |
|
|
3,750 |
Example of calculation based on weekly market trend for 1.00 Lot1
|
GOLD |
||||||
|
Pivot Points |
||||||
|
Profit or loss in $ |
20,200 |
15,200 |
10,200 |
-9,800 |
-12,300 |
-14,800 |
|
Profit or loss in €² |
18,029 |
13,567 |
9,104 |
-8,747 |
-10,978 |
-13,210 |
|
Profit or loss in £² |
15,063 |
11,334 |
7,606 |
-7,308 |
-9,172 |
-11,036 |
|
Profit or loss in C$² |
28,232 |
21,244 |
14,256 |
-13,697 |
-17,191 |
-20,685 |
- The above calculations are made based on 1.00 lot which is equivalent of 100 units
- Calculations for exchange rate used as of 11:00 (GMT) 02/11/2026
You can use risk management tools such as Stop-Loss and Take-Profit.


