SILVER
November 9, 2026
Risk Disclaimer: The example below is for illustrative purposes only and is based on price movements derived from Contracts for Difference (CFDs). The calculations reflect hypothetical outcomes using historical or specified price data for the relevant instrument on the stated date and are not indicative of future performance. Any reliance placed on this material is strictly at the user’s own risk.
Weekly Special Report: SILVER
U.S. MIDTERM ELECTIONS:
- BREAKING (NOVEMBER 3): U.S. DEMOCRATS WIN CONTROL OF BOTH CHAMBERS OF CONGRESS. Democrats secured major victories in the U.S. midterm elections, taking control of both the House of Representatives and the Senate and ending Republican control of Congress. This creates a divided government under President Trump, potentially increasing political uncertainty and making it harder to pass new legislation.
- EVENT (FRIDAY, DECEMBER 11): U.S. GOVERNMENT FACES ANOTHER SHUTDOWN DEADLINE. President Trump signed a temporary funding bill in September, keeping the government operational until December 11, 2026. Congress must reach a new funding agreement before then to avoid another shutdown.
Data Source: Investing.com
ECONOMIC DATA
- TUESDAY, NOVEMBER 10, AT 13:30 GMT: U.S. INFLATION (CPI) (OCTOBER) (MONTHLY). U.S. Headline Inflation (CPI) (Monthly) is expected to show a decline from September’s 0.6%. Core Inflation (CPI) (Monthly) is expected to show a decline from September’s 0.3% as well.
NOTE: Year-over-Year (YoY) Rate (Annual): No official annual inflation rate will be published for headline or core CPI because the US government shutdown in October 2025 disrupted data collection, leaving no data for comparison.
- FRIDAY, NOVEMBER 13, AT 13:30 GMT: U.S. PRODUCERS’ PRICE INDEX (PPI) (OCTOBER) (MONTHLY). U.S. Headline PPI (Monthly) is expected to show a decline from September’s 1.3%. Core PPI (Monthly) is expected to show a decline from September’s 0.7% as well.
NOTE: Year-over-Year (YoY) Rate (Annual): No official annual rate will be published for headline or core PPI because the US government shutdown in October 2025 disrupted data collection, leaving no data for comparison.
Source: Investing.com
TECHNICAL ANALYSIS:
- BREAKING (NOVEMBER 4): SILVER PRICE HIT ITS LOWEST RATE SINCE NOVEMBER 2025 ($48.586).
- SUPPORT AREA: $50 - $45: Silver prices tested this region again in late October and early November, for the first time since late 2025. In early November 2026, silver reached its lowest level since November 2025, falling to $48.586.
- UPTREND 2025 - 2026. Although silver prices have pulled back in 2026, they are still up around 78% since the beginning of 2025. However, prices could decline further.
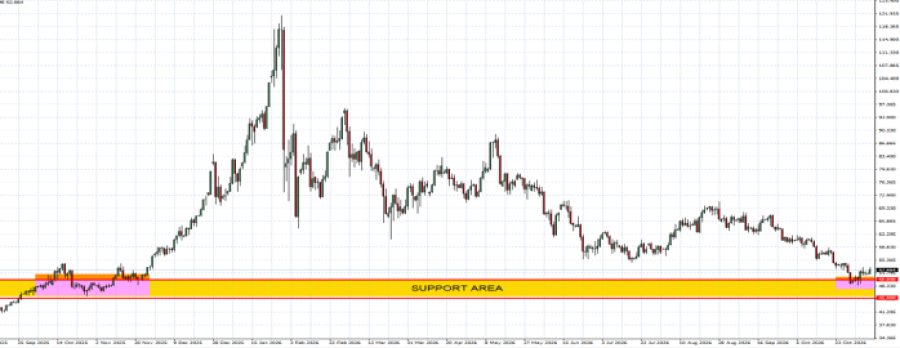
GRAPH (Daily): September 2025 – November 2026
Please note that past performance does not guarantee future results
Silver, November 9, 2026
Current Price: 52.50
|
SILVER |
Weekly |
|
Market Trend |
|
|
63.00 |
|
|
60.00 |
|
|
58.00 |
|
|
48.00 |
|
|
47.00 |
|
|
46.00 |
Example of calculation based on weekly market trend for 1.00 Lot1
|
SILVER |
||||||
|
Pivot Points |
||||||
|
Profit or loss in $ |
105,000 |
75,000 |
55,000 |
-45,000 |
-55,000 |
-65,000 |
|
Profit or loss in €² |
93,849 |
67,035 |
49,159 |
-40,221 |
-49,159 |
-58,097 |
|
Profit or loss in £² |
78,257 |
55,898 |
40,992 |
-33,539 |
-40,992 |
-48,445 |
|
Profit or loss in C$² |
148,048 |
105,749 |
77,549 |
-63,449 |
-77,549 |
-91,649 |
- The above calculations are made based on 1.00 lot which is equivalent of 10,000 units
- Calculations for exchange rate used as of 13:00 (GMT) 09/11/2026
You can use risk management tools such as Stop-Loss and Take-Profit.


