Special Report: USA500
Date: January 4, 2023
WEEKLY TREND: UP
US STOCK MARKETS
- STOCK MARKET TREND DEFINITION
BEAR MARKET: DEFINITION. According to Forbes, economists define a bear market as a decline of 20% or more of a major stock market index, such as the S&P 500, for a sustained period. SENTIMENT: During a bear market, market sentiment is poor. Investors are pessimistic about the stock market’s prospects, making them more likely to sell assets than hold them.
BULL MARKET: DEFINITION. While bear markets signal a time of pessimism and economic decline, a bull market is defined by optimism and economic growth. A bull market is a period when stock prices are rising and investor sentiment is positive. During a bull market, stocks in a broad market index increase in value by 20% or more.
Table: Bear and Bull Market Characteristics
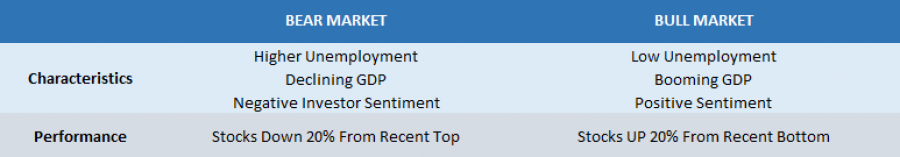
Data Source: Forbes
USA500 INDEX
- THE CASE OF THE USA500 INDEX
BEAR MARKET CONFIRMED on May 20, 2022. The Index fell 20% from 4807.82 (January 2, 2022) to 3846.25 (May 15, 2022). The market has been there for the past 11- 12 months, having a maximum drop of 27.16% (October 13, 2022).
BEAR MARKET BOTTOM: October 13, 2022. The Index fell to 3502.08 by October 13, 2022, marking a total decline of 27.16% from its recent top of 4807.82 (January 2, 2022).
INDEX HAS RISEN 9.93% FROM RECENT BOTTOM: January 4, 2023. The index currently trades around 3850. If it adds 9% more, it will then confirm the index is in a new Bull Market. However, the price could decline further.
- MOST RECENT RECOVERY FOLLOWING A BEAR MARKET (USA500):
2020 (COVID PANDEMIC DECLINE): After the pandemic decline of 34%, testing the rate of 2170.25 (March 22, 2020), the index had risen around 121.5% to its most recent all time high of 4807.82 (January 2, 2022).
2007- 2008 (GLOBAL FINANCIAL CRISIS): After a decline of around 57%, testing the rate of 665.75 (March 1, 2009), the index trended up in a strong bull run to add around 410% until the Covid Pandemic Crisis (February 16, 2020 to reach the level of 3397.08).
However, please note that past performance does not guarantee future results.
STOCK MARKET TRENDS
- THE JANUARY EFFECT:
According to Investopedia, The January Effect is a market anomaly whereby stock prices may tend to rise in the first month of the year.
However, please note that past performance does not guarantee future results.
JANUARY ECONOMIC CALENDAR
- EVENT (Friday, January 6 at 13:30 GMT): US NONFARM PAYROLLS AND UNEMPLOYMENT RATE (December). NFP is expected to come in at 220,000, while the unemployment rate at 3.7% (unchanged).
- EVENT (Thursday, January 12 at 13:30 GMT): US INFLATION (December). US inflation in November fell to 7.1%. December Inflation is expected to show a decrease to 6.7% (according to Bloomberg estimates).
- EVENT (JANUARY 13): US QUARTERLY (Q4) EARNINGS SEASON STARTS. US inflation in November fell to 7.1%. December Inflation is expected to show a decrease to 6.7% (according to Bloomberg estimates). Falling inflation is expected to further encourage the US Federal Reserve to finish the current rate hike cycle at the end of Q1 of 2023.
- EVENT (FEBRUARY 1): US FEDERAL RESERVE INTEREST RATE DECISION. FEDERAL RESERVE raised interest rates as expected by 0.50% points to 4.50% in December. The markets also expect that the Fed will close the current hike cycle by the end of Q1 of 2023, raising the benchmark interest rate to terminal 5.00%.
Current Price: 3850
|
USA500 |
Weekly |
|
Trend direction |
|
|
4200 |
|
|
4100 |
|
|
3980 |
|
|
3740 |
|
|
3700 |
|
|
3660 |
Example of calculation based on weekly trend direction for 1 Lot1
|
USA500 |
||||||
|
Pivot Points |
||||||
|
Profit or loss in $ |
3,500 |
2,500 |
1,300 |
-1,100 |
-1,500 |
-1,900 |
|
Profit or loss in €2 |
3,296 |
2,354 |
1,224 |
-1,036 |
-1,413 |
-1,789 |
|
Profit or loss in £2 |
2,901 |
2,072 |
1,077 |
-912 |
-1,243 |
-1,575 |
|
Profit or loss in C$2 |
4,743 |
3,388 |
1,762 |
-1,491 |
-2,033 |
-2,575 |
1. 1.00 lot is equivalent of 10 units
2. Calculations for exchange rate used as of 09:31 (GMT) 4/1/2023
Fortrade recommends the use of Stop-Loss and Take-Profit, please speak to your Senior Account ManagerClient Manager regarding their use.
- You may wish to consider closing your position in profit, even if it is lower than suggested one
- Trailing stop technique can protect the profit – Ask your Senior Account ManagerClient Manager for more detail