META (#FACEBOOK)
October 14, 2026
Risk Disclaimer: The example below is for illustrative purposes only and is based on price movements derived from Contracts for Difference (CFDs). The calculations reflect hypothetical outcomes using historical or specified price data for the relevant instrument on the stated date and are not indicative of future performance. Any reliance placed on this material is strictly at the user’s own risk.
Weekly Special Report: META (#FACEBOOK)
META (FACEBOOK): ARTIFICIAL INTELLIGENCE WORLD
- META A.I.: According to Meta, its latest flagship AI models, Muse Wonder and Muse Wonder Full, launched in October 2026, are designed to compete with leading AI systems from OpenAI, Anthropic, and Google. Built for coding, advanced reasoning, and specialized professional tasks, these models represent a major step in Meta’s AI ambitions, expanding its capabilities across software development, complex workflows, and its broader AI ecosystem.
- META A.I.-DRIVEN ADVERTISING: Meta is revolutionizing digital advertising through AI, enhancing ad targeting, maximizing engagement, and driving stronger advertising performance, putting the company on track to potentially becoming the world’s largest digital advertising business by the end of 2026.
- META STOCK belongs to the two most important US stock indices, including the NASDAQ 100 (USA100) index and the S&P 500 (USA500) index.
META (FACEBOOK): Q3 2026 EARNINGS
- EVENT (Q3 2026, AFTERMARKET): Q3 EARNINGS REPORT. Meta expects to publish $63.40 billion in revenue, which would be an increase of 23.68% from the same period last year ($51.24 billion). The company is expected to release approximately $16.32 billion in net Income, which would indicate an increase of 502.21% from the same period last year ($2.71 billion).
- STATISTIC (LAST 8 QUARTERS): HISTORICAL PERFORMANCE SHOWS THAT META TENDS TO BEAT ANALYSTS’ EXPECTATIONS. Meta has beaten revenue estimates 8 times over the past 8 quarters, net income 7 times over the past 8 quarters, and it has managed to beat earnings per share (EPS) estimates 7 times over the past 8 quarters.
- LAST TIME (Q2 2026 EARNINGS RELEASED ON WEDNESDAY, JULY 29, 2026): Meta reported total revenue of $60.80 billion, up 27.96% year-over-year and above analysts’ expectations of $60.22 billion. However, earnings per share (EPS) came in at $6.18, below the expected $7.19.
Source: Bloomberg Terminal, Meta Investor Relations
Please note that past performance does not guarantee future results
META (FACEBOOK): NEWS
- BREAKING NEWS: META'S MUSE PERSONAL AI ASSISTANT SURPASSES 5 MILLION DOWNLOADS WITHIN 22 DAYS OF LAUNCH (OCTOBER 12, 2026). Meta's rapid AI expansion continues with the launch of Muse Wonder and Muse Wonder Full, alongside paid subscriptions opening new monetization opportunities beyond advertising.
- BREAKING NEWS: META STOCK SPLIT SPECULATION GROWS AS SHARE PRICE CLIMBS. Meta has never completed a stock split, and with its share price reaching much higher levels, investors are increasingly watching for a potential split announcement. A stock split would make shares more affordable for individual investors while signaling management’s confidence in Meta’s continued growth.
META (FACEBOOK): TECHNICAL ANALYSIS
- SUPPORT AREA: $700 – $670. This zone is the support area for Meta (Facebook) stock prices, after the most recent uptrend (black trend lines).
- GOLDEN CROSS: On October 6, Meta triggered a rare Golden Cross, in which its 50-day moving average crossed above its 200-day moving average, a technical indicator that has historically indicated a continued positive trend. However, prices could also fall.
- FORECAST (Source: Bloomberg Terminal): Rosenblatt Securities forecasts $1,015; Truist Financial forecasts $1,000, Wells Fargo forecasts $1,000; Rothschild & Co. forecasts $1,000; Loop Capital forecasts $940; and J.P. Morgan forecasts $920.
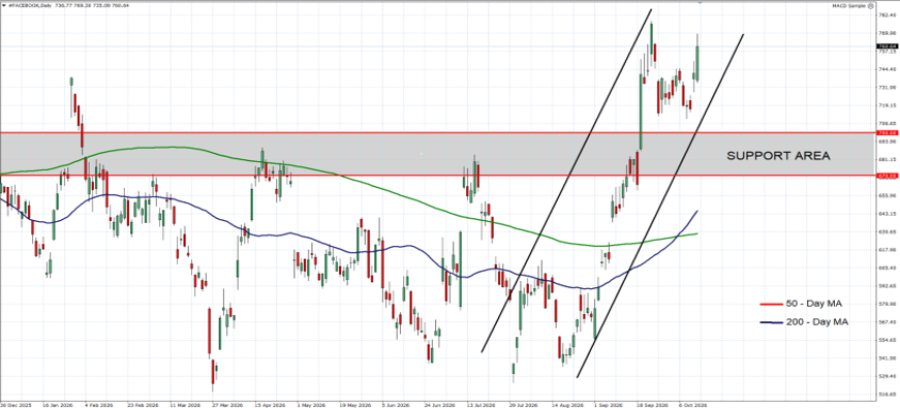
GRAPH (Daily): December 2025 – October 2026
Please note that past performance does not guarantee future results
#FACEBOOK, October 13, 2026
Current Price: 764
|
|
Weekly |
|
Market Trend |
|
|
1,000 |
|
|
900 |
|
|
830 |
|
|
700 |
|
|
680 |
|
|
670 |
Example of calculation based on weekly market trend for 1.00 Lot1
|
|
||||||
|
Pivot Points |
||||||
|
Profit or loss in $ |
236,000 |
136,000 |
66,000 |
-64,000 |
-84,000 |
-94,000 |
|
Profit or loss in €² |
210,829 |
121,495 |
58,961 |
-57,174 |
-75,041 |
-83,974 |
|
Profit or loss in £² |
177,976 |
102,563 |
49,773 |
-48,265 |
-63,347 |
-70,889 |
|
Profit or loss in C$² |
335,427 |
193,297 |
93,806 |
-90,963 |
-119,389 |
-133,602 |
- The above calculations are made based on 1.00 lot which is equivalent of 1,000 units
- Calculations for exchange rate used as of 09:30 (GMT+1) 14/10/2026.
You can use risk management tools such as Stop-Loss and Take-Profit


