USD/CAD
June 11, 2024
Risk Disclaimer: The example below is for illustrative purposes only and is based on price movements derived from Contracts for Difference (CFDs). The calculations reflect hypothetical outcomes using historical or specified price data for the relevant instrument on the stated date and are not indicative of future performance. Any reliance placed on this material is strictly at the user’s own risk.
USD/CAD weekly special report based on 1 Lot Calculation:
- EVENT (WEDNESDAY, JUNE 12 AT 13:30 GMT+1): US INFLATION (CPI) (MAY). The US Inflation stands currently at 3.4%, down from previous 3.5%, which could also encourage the Fed to consider cutting its rates in the coming period. This could be negative for the US dollar.
- EVENT (WEDNESDAY, JUNE 12 AT 19:00 GMT+1): US FEDERAL RESERVE INTEREST RATE DECISION. The US Fed is expected to keep interest rates unchanged at 5.50% on Wednesday, but they are still expected to cut rates at least twice by 0.25% points by the end of 2024. If confirmed by the Fed, the US dollar could come under negative pressure.
- EVENT (TUESDAY, JUNE 25 AT 13:30 GMT+1): CANADA INFLATION (CPI) (MAY). The Canadian Inflation stands currenly at 2.7%, down from previous 2.9%. The Canadian inflation is still above the central bank’s target of 2.00%, which could discourage the Bank of Canada to keep cutting its benchmark interest rate. This could be positive for the Canadian Dollar.
- TECHNICAL ANALYSIS: THE USD/CAD IS TRADING NEAR THE TOP OF ITS SIDEWAYS CHANNEL (BETWEEN 1.3200 AND 1.3850). The chanel has been in place since mid- 2022, whereby the USD/CAD has tested the upper boundary of 1.38500 four times. On the downside, the USD/CAD has tested the lower boundery three times over the same period. The USD/CAD could be expected to soon undergo a downward correction after recently testing its upper boundary of 1.38500.
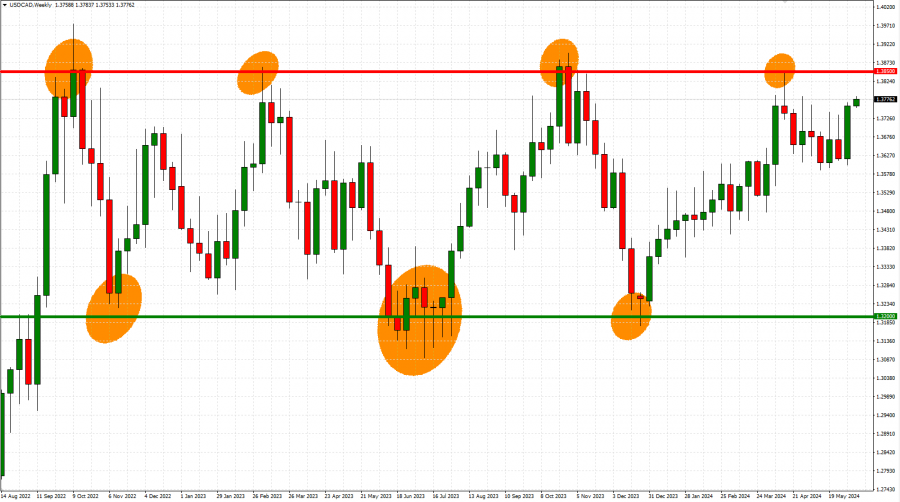
GRAPH: Weekly (July 2022 – June 2024)
USD/CAD, June 11, 2024
Current Price: 1.3780
|
USD/CAD |
Weekly |
|
Trend direction |
|
|
1.3950 |
|
|
1.3915 |
|
|
1.3880 |
|
|
1.3650 |
|
|
1.3500 |
|
|
1.3400 |
Example of calculation based on weekly trend direction for 1 Lot1
|
USD/CAD |
||||||
|
Pivot Points |
||||||
|
Profit or loss in $ |
-1,234 |
-980 |
-726 |
943 |
2,032 |
2,758 |
|
Profit or loss in €2 |
-1,150 |
-913 |
-676 |
879 |
1,894 |
2,570 |
|
Profit or loss in £2 |
-968 |
-769 |
-570 |
741 |
1,595 |
2,165 |
|
Profit or loss in C$2 |
-1,700 |
-1,350 |
-1,000 |
1,300 |
2,800 |
3,800 |
1. 1.00 lot is equivalent of 100,000 units
2. Calculations for exchange rate used as of 12:52 (GMT+1) 11/06/2024
Fortrade recommends the use of Stop-Loss and Take-Profit, please speak to your Senior Account ManagerClient Manager regarding their use.
- You may wish to consider closing your position in profit, even if it is lower than suggested one
- Trailing stop technique can protect the profit – Ask your Senior Account ManagerClient Manager for more detail


