Dollar - Canadian Dollar Analysis 13/01/2021
January 13, 2021
Fundamental analysis
Technical analysis
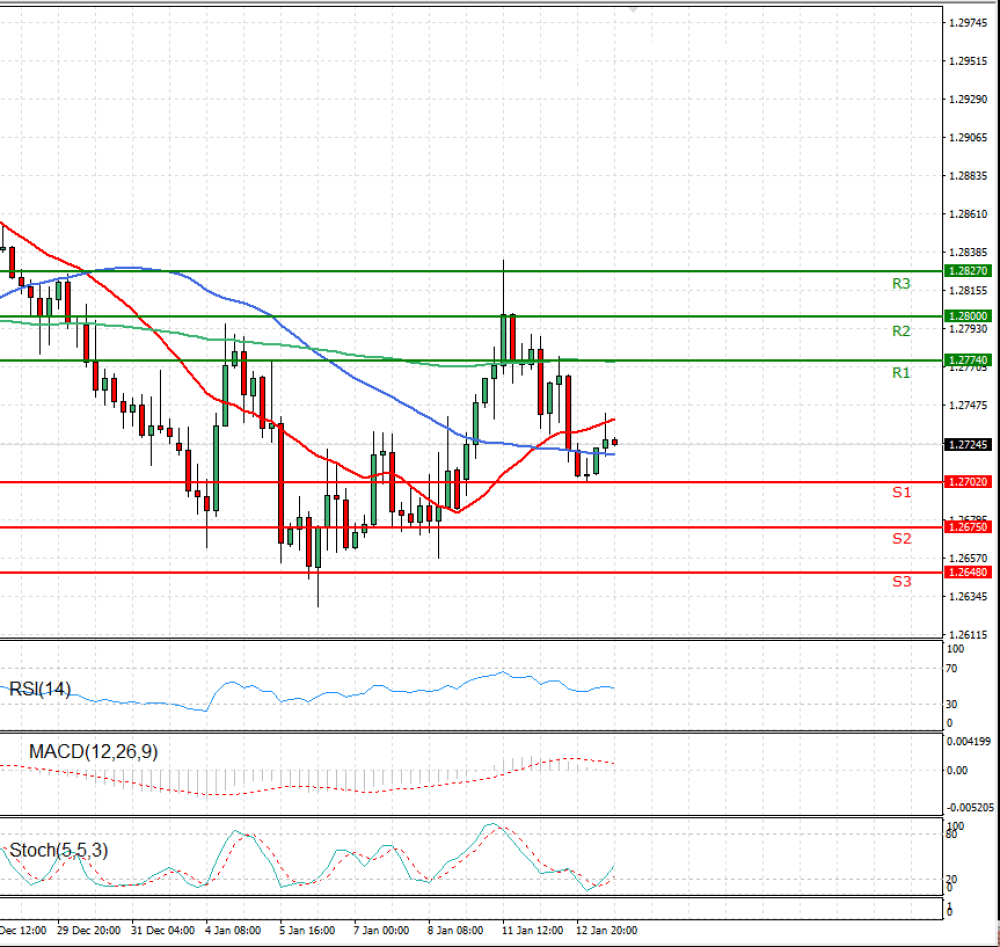
USD-CAD Support & Resistance Table - 2021-01-13
| Support & Resistance Table | Level | Explanation |
|---|---|---|
| Resistance 2 | 1.2800 | Daily R2 |
| Resistance 1 | 1.2774 | Daily R1 |
| Support 1 | 1.2702 | Daily S1 |
| Support 2 | 1.2675 | Daily S2 |
USD-CAD Indicator Table - 2021-01-13
| Indicator | Signal |
|---|---|
| SMA 20 | SELL |
| SMA 50 | BUY |
| SMA 100 | SELL |
| MACD( 12;26;9) | BUY |
| RSI (14) | SELL |
| Stochastic ( 9;6;3) | BUY |
USD-CAD Indicator / Period Table - 2021-01-13
| Indicator / Period | Day SELL | Week SELL | Month SELL |
|---|---|---|---|
| MACD( 12;26;9) | BUY | SELL | SELL |
| RSI (14) | SELL | SELL | SELL |
| SMA 20 | SELL | SELL | SELL |
USD-CAD 2021-01-13 - Reference Price : 1.2724
| Status | Subject | SMS status | Indicators status |
|---|---|---|---|
| SELL | Simple Moving Average | Buy (1) | Sell (2) |
| Technical Indicators - Oscillators | Buy (2) | Sell (1) |

USD/CAD
+0.44%


