USA500
November 5, 2026
Risk Disclaimer: The example below is for illustrative purposes only and is based on price movements derived from Contracts for Difference (CFDs). The calculations reflect hypothetical outcomes using historical or specified price data for the relevant instrument on the stated date and are not indicative of future performance. Any reliance placed on this material is strictly at the user’s own risk.
Weekly Special Report: USA500
USA500:
-
USA500 represents the S&P 500, which includes 500 of the largest publicly traded companies in the United States across all major sectors. It features industry leaders such as Tesla, Apple, Google, Nvidia, Meta, Amazon, Microsoft, and Goldman Sachs.
EVENT: Q3 2026 EARNINGS SEASON
-
US Q3 EARNINGS SEASON: The Q3 earnings season is continuing strong; AMD delivered a strong indication that the AI boom is continuing. Q3 revenue hit a record $13.4 billion, Data Center sales nearly doubled (+97%) on record AI chip sales, potentially driving the USA500 to new all-time highs.
COMPANY EARNINGS CALENDAR: Q3 2026 EARNINGS SEASON (Confirmed)
-
Airbnb: 5/11/2026, Aftermarket
-
Applied Materials: 12/11/2026, Aftermarket
-
Aftermarket NVIDIA: 17/11/2026, Aftermarket
-
Target: 18/11/2026, Premarket
-
Walmart: 19/11/2026, Premarket
-
Dell: 24/11/2026, Aftermarket
EVENTS:
-
FRIDAY, NOVEMBER 6 AT 14:30 GMT+1: U.S. NON-FARM PAYROLLS (NFP) AND UNEMPLOYMENT RATE. Economists expect the U.S. economy to add 63,000 jobs in October, up from 29,000 previously, while the unemployment rate is forecast to remain unchanged at 4.2%
-
TUESDAY, NOVEMBER 10 AT 14:30 GMT+1: U.S. CONSUMER PRICE INDEX (CPI). An important inflation report that could influence the Federal Reserve’s next interest rate decision and offer significant potential upside for the USA500. Markets will closely monitor the figures for signs of easing inflation and a possible shift towards lower interest rates.
TECHNICAL ANALYSIS:
-
SUPPORT AREA: 7,6-7,500. After reaching a record high of 7,897, the USA500 has remained above the 7,550–7,500 support area. This range could continue to provide support during potential market pullbacks, although a deterioration in market sentiment could lead to a break below these levels.
-
UPTREND: The USA500 has continued to trend higher in 2026, rising a maximum of 11% before the most recent dip, although prices could also decline.
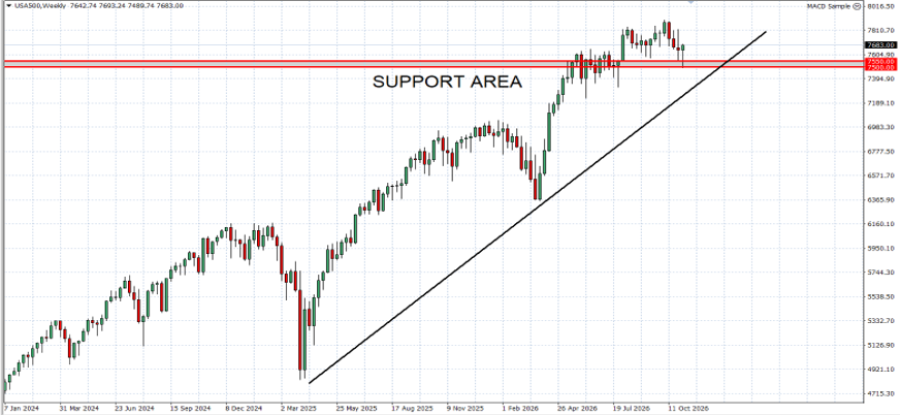
GRAPH (Weekly): January 2024 – October 2026
Please note that past performance does not guarantee future results
USA500, November 5, 2026
Current Price: 7,718
|
USA500 |
Weekly |
|
Market Trend |
|
|
7,950 |
|
|
7,875 |
|
|
7,825 |
|
|
7,550 |
|
|
7,525 |
|
|
7,500 |
Example of calculation based on weekly market trend for 1.00 Lot1
|
USA500 |
||||||
|
Pivot Points |
||||||
|
Profit or loss in $ |
2,820 |
2,320 |
1,570 |
-1,180 |
-1,430 |
-1,680 |
|
Profit or loss in €2 |
2,385 |
1,962 |
1,328 |
-998 |
-1,210 |
-1,421 |
|
Profit or loss in £2 |
2,092 |
1,721 |
1,165 |
-875 |
-1,061 |
-1,246 |
|
Profit or loss in C$2 |
3,938 |
3,240 |
2,192 |
-1,648 |
-1,997 |
-2,346 |
- The above calculations are made based on 1.00 lot which is equivalent of 10 units
- Calculations for exchange rate used as of 11:21 (GMT+1) 11/05/2026
You can use risk management tools such as Stop-Loss and Take-Profit