Los CFDs son instrumentos complejos y conllevan un alto riesgo de perder dinero rápidamente debido al apalancamiento. El 71% de las cuentas de inversores minoristas pierden dinero al operar con CFDs con este proveedor. Debe considerar si entiende cómo funcionan los CFD y si puede permitirse asumir el alto riesgo de perder su dinero.
Los CFD son instrumentos complejos y conllevan un alto riesgo de perder dinero rápidamente debido al apalancamiento. El 70.91% de las cuentas de inversores particulares pierden dinero cuando invierten en CFD con este proveedor. Debe considerar si comprende cómo funcionan los CFD y si puede permitirse asumir el alto riesgo de perder todo su capital invertido.

Oro - Dólar estadounidense Análisis

Análisis de la sesión de EE.UU. para instrumentos CFD 28/03/2024

Análisis fundamental

28 marzo, 2024

Gold prices are trading higher in today’s European session above 2200 levels.

On Thursday, gold prices surged to highs at $2,210. Currently, there is a 62% likelihood of the initial interest rate reduction occurring in June.

Should the pivot be delayed until the third quarter or if the number of cuts is reduced to two or one, rather than the anticipated three, it will prompt a correction in both silver and gold prices. Especially susceptible to a retreat towards crucial support levels following its consistent ascent is gold.

Following the conclusion of the Fed meeting, the market will shift its attention to forthcoming macroeconomic data. Today, we anticipate the release of US GDP growth figures. If these figures corroborate the preliminary estimates, we can anticipate a substantial downturn compared to recent quarters.
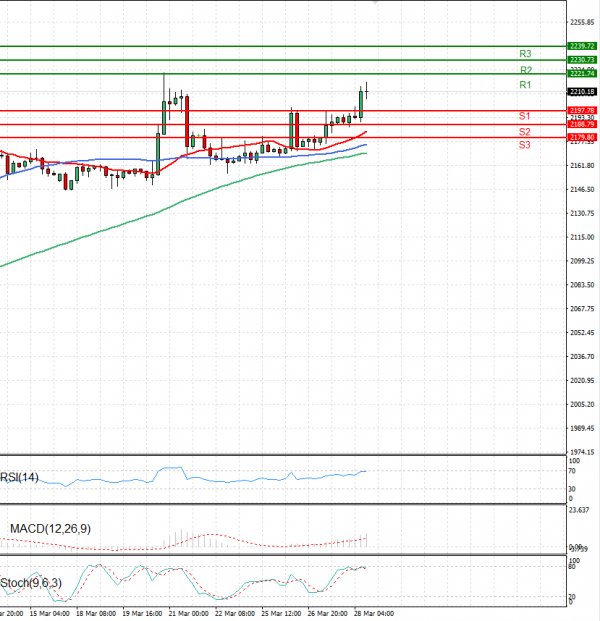
Análisis Técnicos

Oro - Dólar estadounidense Análisis Análisis Técnicos 28/03/2024
Time Frame: 1 hour

GOLD Tabla de soporte y resistencia - 28/03/2024

Soporte y resistencia Nivel Explicación
Resistencia 2 2230.73 Daily R2
Resistencia 1 2221.74 Daily R1
Soporte 1 2197.78 Daily S1
Soporte 2 2188.79 Daily S2

GOLD Tabla de indicadores - 28/03/2024

Indicador Señal
SMA 20 Compra
SMA 50 Compra
SMA 100 Compra
MACD( 12;26;9) Compra
RSI (14) Neutral Diario
Stochastic ( 9;6;3) Venta

GOLD Tabla de indicadores / periodos - 28/03/2024

Indicador / Periodo Día - CompraSemana - CompraMes - Compra
MACD( 12;26;9) Compra CompraCompra
RSI (14) Neutral Diario CompraCompra
SMA 20 Compra CompraCompra

GOLD 28/03/2024 - Precio de Referencia : 2210.18

Compra
Media Móvil SimpleCompra (3)Venta (0)
Indicadores técnicos - OsciladoresCompra (1)Venta (1)
Compártelo con tu red
GOLD (Oro) Gráfico
Hora actualizada: -
Highest Diario
Lowest Diario
1M 5M H D S
Los precios se están cargando..
¿Listo/a para operar?Empezar Ahora