Copper Weekly Special Report based on 1 Lot Calculation:
COPPER USE AND MARKET SHARE:
- TOP COPPER PRODUCERS: The biggest producers of copper are: Chile (27% of the world total), China (8%), Peru (8%), the Democratic republic of Congo (6%), Australia (5%), Mexico (5%), Russia (3%), and Canada (2%).
- TOP COPPER CONSUMERS: The biggest consumers of copper are: China (52% of the world’s total), the United States (7%), The European Union (8%), and Japan (4%).
- TOP COPPER INDUSTRIES: Copper is heavily demanded in the EV industry, renewable energy industry (wind & solar farms), electrical infrastructure, telecommunications, and construction. The EV and green industries show the biggest growth rates (10-15% and 5%, respectively).
- COPPER DEMAND EXPANDS DUE TO RAPID BUILD-OUT OF AI INFRASTRUCTURE AND DATA CENTERS. AI and data centers are fueling unprecedented copper demand, as their energy-intensive operations require large quantities of copper for power delivery, cooling systems, and networking. Single hyperscale AI facilities can consume tens of thousands of tons—far exceeding conventional data centers—driving global copper consumption to record levels and potentially putting pressure on supply (Source: datacentermagazine.com; copper.org; bhp.com).
COPPER MARKET: TIGHT SUPPLY AND STRUCTURAL DEMAND SUPPORT 2026 OUTLOOK
- MARKET BALANCE: COPPER MARKET EXPECTED TO BE IN DEFICIT IN 2026. Ongoing mine disruptions around the world, and declining ore grades continue to restrict supply growth, while demand remains supported by electrification and A.I. infrastructure needs.
- SUPPLY CONSTRAINTS: MINE OUTPUT LIMITED AS THE SECOND LARGEST COPPER MINE IN THE WORLD REMAINS SHUT DOWN. The Grasberg copper mine located in Indonesia suffered a fatal murdush in September 2025, forced the shutdown of more than 70% of its operations. Grasberg is the world’s second-largest copper mine and accounts for approximately 6–7% of global copper production. According to the latest estimates, analysts expect the Grasberg mine to reopen in the first quarter of 2027.
- INDUSTRIAL DEMAND: ELECTRIFICATION AND A.I. INFRASTRUCTURE INVESTMENT UNDERPIN STRUCTURAL DEMAND. Copper demand remains structurally strong, supported by power grid expansion, renewable energy projects, A.I. Data centers construction, electric vehicles, and rising industrial activity, all reinforcing demand outlook into 2026.
EVENTS:
- FRIDAY, JANUARY 9 AT 01:30 GMT: CHINA INFLATION DATA (CPI) (DECEMBER). A stronger CPI reading would indicate improving demand conditions in China, supporting industrial activity and construction, which could be supportive for copper prices.
- FRIDAY, JANUARY 9 AT 13:30 GMT: U.S. NONFARM PAYROLLS (NFP) AND UNEMPLOYMENT RATE (DECEMBER). Weaker-than-expected job growth and a higher unemployment rate could increase expectations of U.S. interest rate cuts, weighing on the dollar and commodities such as copper.
- MONDAY, JANUARY 19 AT 02:00 GMT: CHINA GROSS DOMESTIC PRODUCT (GDP) (Q4). Stronger-than-expected GDP growth would indicate improving economic momentum in China, supporting industrial production and infrastructure investment, both key drivers of copper demand.
TECHNICAL ANALYSIS:
- UPTREND AND RECOVERY SINCE EARLY AUGUST 2025: Copper prices have traded within an uptrend channel since early August, as depicted by the daily chart below. However, there remains a risk of a potential breakout below this level if market conditions change.
- DAILY MOVING AVERAGES POINT TO UPTREND: Copper prices have recently traded above the 20-, 50- and 100-Daily Moving Averages, pointing to an ongoing uptrend. However, Copper prices can also change their trend, if prices fall below the 20, - 50- and 100-Daily Moving Averages.
- SUPPORT AREA: $5.60 – $5.70. This zone represents an important psychological support area for copper prices.
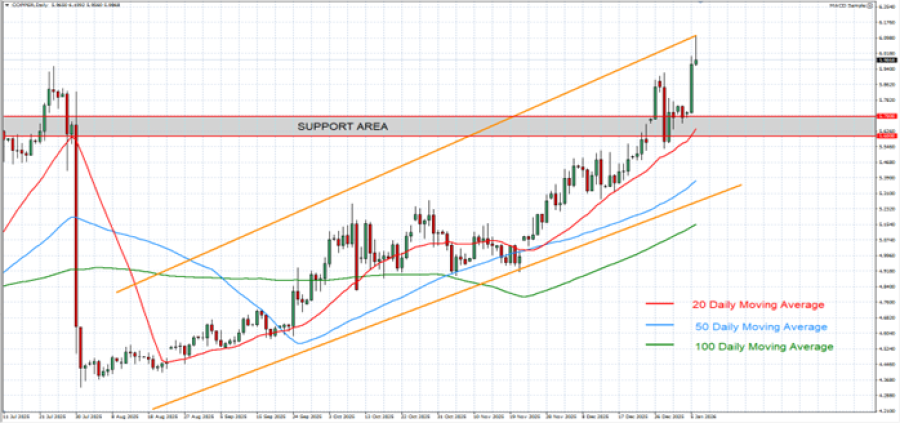
GRAPH (Daily): July 2025 - January 2026
Please note that past performance does not guarantee future results
COPPER, January 6, 2026.
Current Price: 6.000
|
COPPER |
Weekly |
|
Trend direction |
|
|
6.600 |
|
|
6.500 |
|
|
6.400 |
|
|
5.700 |
|
|
5.650 |
|
|
5.600 |
Example of calculation based on weekly trend direction for 1.00 Lot1
|
COPPER |
||||||
|
Pivot Points |
||||||
|
Profit or loss in $ |
6,000 |
5,000 |
4,000 |
-3,000 |
-3,500 |
-4,000 |
|
Profit or loss in €² |
5,122 |
4,268 |
3,415 |
-2,561 |
-2,988 |
-3,415 |
|
Profit or loss in £² |
4,432 |
3,693 |
2,954 |
-2,216 |
-2,585 |
-2,954 |
|
Profit or loss in C$² |
8,259 |
6,882 |
5,506 |
-4,129 |
-4,818 |
-5,506 |
- 1.00 lot is equivalent of 10 000 units
- Calculations for exchange rate used as of 9:47 (GMT) 6/1/2026
There is a possibility to use Stop-Loss and Take-Profit
- You may wish to consider closing your position in profit, even if it is lower than the suggested one.
- Trailing stop technique could protect the profit