Crude Oil weekly special report based on 1.00 Lot Calculation:
TECHNICAL ANALYSIS:
- 50- DAY AND 100- DAY MOVING AVERAGES INDICATE UPTREND: The crude oil prices have remained above the mid-term daily moving averages (50- and 100- day moving averages), pointing to ongoing positive sentiment. Although, the sentiment could change should oil prices fall below the 50- and 100- day moving averages.
- UPTREND SINCE EARLY MAY 2025: As depicted by the daily chart below, the crude oil price has kept trading above the mid-term black- lined uptrend line, confirming its mid-term trend is up.
- NEAR-TERM SUPPORT AREA: $65 AND BELOW. As depicted by the daily chart below, over the past two weeks the crude oil prices have maintained stronger support at $65 or slightly below it since
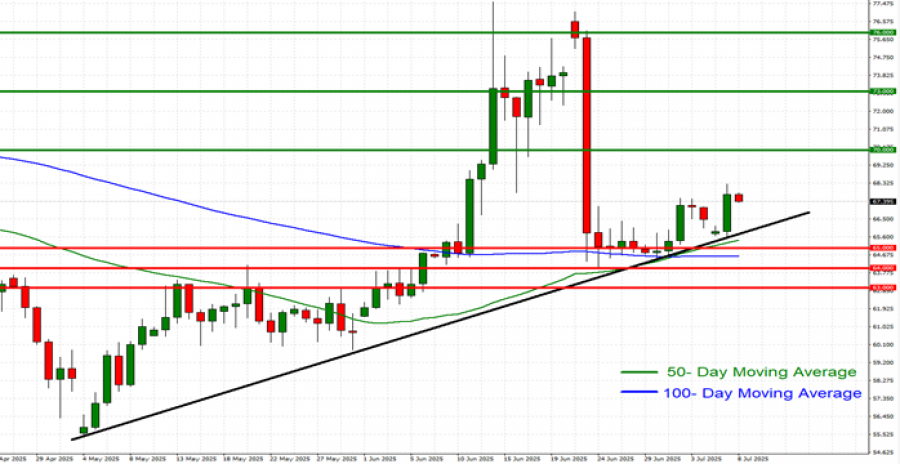
GRAPH (Daily): May 2025 – July 2025
Please note that past performance does not guarantee future results
GEOPOLITICS: TRADE PROGRESS
- US TARIFF DEADLINE EXTENDED TO AUGUST 1 FROM THE PREVIOUS JULY 9. The US is still expected to announce more deals after clinching deals with the UK, China and Vietnam. Next on the list might be Japan, the E.U., India, Canada, Mexico and South Korea.
- BREAKING (JULY 2): U.S. AND VIETNAM REACHED A TRADE DEAL. President Donald Trump said the United States has struck a trade deal with Vietnam. The agreement includes a 20% U.S. tariff on Vietnamese goods.
- BREAKING (MAY 8): U.S. AND U.K. ANNOUNCED A TRADE DEAL ON THURSDAY, MAY 8. President Trump said this is the first of many to follow.
EVENTS (ECONOMIC CALENDAR):
- TUESDAY, JULY 8 AT 21:30 GMT+1: AMERICAN PETROLEUM INSTITUTE (API) WEEKLY OIL INVENTORY DATA (USA). If data showed a declining inventory for the past week, then positive support for the oil price could be expected. However, the price could decline.
- WEDNESDAY, JULY 9 AT 15:30 GMT+1: ENERGY INFORMATION ADMINISTRATION (EIA) OIL INVENTORY DATA (USA). If data showed a declining inventory for the past week, then positive support for the oil price could be expected. However, the price could decline.
- FRIDAY, JULY 11 AT 09:00 GMT+1: INTERNATIONAL ENERGY AGENCY (IEA) OIL MONTHLY REPORT. The report oftentimes tries to predict the demand-supply relationship in the coming period, which, in turn, tends to impact the current oil prices. If their expectations show higher demand outlook and weaker supply outlook going forward, then oil prices could see some positive pressure, although, price could go into the other direction too.
- TUESDAY, JULY 15 AT 12:40 GMT+1: OPEC OIL MONTHLY REPORT. Similar to the IEA oil monthly report, the OPEC report also tries to predict the demand-supply relationship in the coming period, which, in turn, tends to impact the current oil prices. If their expectations show higher demand outlook and weaker supply outlook going forward, then oil prices could see some positive pressure, although, price could go into the other direction too.
Crude Oil, July 8, 2025.
Current Price: 67.30
|
Crude Oil |
Weekly |
|
Trend direction |
|
|
76.00 |
|
|
73.00 |
|
|
70.00 |
|
|
65.00 |
|
|
64.00 |
|
|
63.00 |
Example of calculation based on weekly trend direction for 1.00 Lot1
|
Crude Oil |
||||||
|
Pivot Points |
||||||
|
Profit or loss in $ |
8,700 |
5,700 |
2,700 |
-2,300 |
-3,300 |
-4,300 |
|
Profit or loss in €² |
7,404 |
4,851 |
2,298 |
-1,957 |
-2,809 |
-3,660 |
|
Profit or loss in £² |
6,387 |
4,185 |
1,982 |
-1,689 |
-2,423 |
-3,157 |
|
Profit or loss in C$² |
11,871 |
7,778 |
3,684 |
-3,138 |
-4,503 |
-5,867 |
- 1.00 lot is equivalent of 1000 units
- Calculations for exchange rate used as of 09:30 (GMT+1) 08/07/2025
There is a possibility to use Stop-Loss and Take-Profit.
- You may wish to consider closing your position in profit, even if it is lower than the suggested one.
- Trailing stop techniques could protect the profit.