Crude Oil weekly special report based on 1.00 Lot Calculation:
GEOPOLITICAL TENSIONS RISE: MIDDLE-EAST
- BREAKING (JANUARY 23): THE US “ARMADA” OF SHIPS HAS ARRIVED IN THE MIDDLE EAST NEAR IRAN, A STRONG INDICATION OF POSSIBLE ESCALATION. The United States had previously directed the USS Abraham Lincoln and its carrier strike group to depart the South China Sea and redeploy toward the Middle East. At the same time, the USS Roosevelt destroyer, equipped with advanced air-defense capabilities, has been positioned to help protect U.S. bases in the region from potential Iranian attacks. In addition, satellite imagery from Muwaffaq Salti Air Base in Jordan shows a notable increase in U.S. military assets, including the deployment of F-15 fighter jets located approximately 900 km from Iran. This development represents one of the most significant U.S. air power buildups in the region in recent years.
IRANIAN OIL PRODUCTION AT RISK: Iran is one of the top three oil producers within OPEC along with Saudi Arabia and Iraq, producing around 4 million barrels of oil per day, which is around 4% of total global supply.
IRAN OIL EXPORTS AT RISK: Iran exports around 1.7 million barrels of oil per day, predominantly to China.
STRAIT OF HORMUZ AT RISK: KEY OIL SUPPLY ROUTE. The Strait of Hormuz is a critical energy chokepoint through which around 20% of global crude oil demand passes, mainly from Saudi Arabia, Kuwait, and Iran. Rising tensions with Iran increase the risk that Tehran could attempt to block or disrupt traffic through the strait, which would significantly tighten global oil supply and add upside pressure to oil prices.
Source: Reuters, CNBC, Bloomberg
OTHER GEOPOLITICS: RUSSIA-UKRAINE CONFLICT
- EVENT (SUNDAY, FEBRUARY 1): A TRILATERAL SUMMIT BETWEEN THE USA, UKRAINE AND RUSSIA WILL TAKE PLACE ON SUNDAY. Ukraine, Russia, and the United States are set to hold three-way talks there on Sunday, following the latest round of talks held on January 23, 2026.
Source: Reuters, CNBC, Bloomberg
OPEC, OPEC+
- NEXT MEETING (OPEC+ V8 MEMBERS): SUNDAY, FEBRUARY 1, 2026. The group comprising Saudi Arabia, Russia, Iraq, the UAE, Kuwait, Kazakhstan, Algeria, and Oman will meet again on February 1. The latest indications point to no changes, meaning no further oil production increases are expected. If OPEC+ stays on hold, positive upward pressure on oil prices could emerge, although prices could also decline.
TECHNICAL ANALYSIS
- SUPPORT AREA: $55 - $60. According to the weekly chart below, crude oil has tested levels between $55 and $60 five times since 2021.
- BREAKING (DECEMBER 16, 2025): CRUDE OIL HAS TESTED ITS LOWEST RATE SINCE FEBRUARY 2021 ($54.865). The crude oil price has tested its lowest rate since February 2021. Currently, crude oil is trading above the $60 mark, floating above its longer-term support area between $55 and $60.
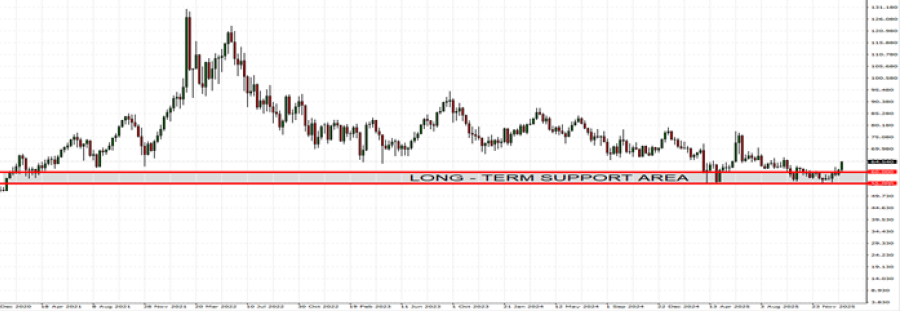
GRAPH (Weekly): December 2020 – January 2026
Please note that past performance does not guarantee future results
Crude Oil, January 29, 2026
Current Price: 64.30
|
Crude Oil |
Weekly |
|
Trend direction |
|
|
75.00 |
|
|
71.00 |
|
|
68.00 |
|
|
61.00 |
|
|
60.00 |
|
|
59.00 |
Example of calculation based on weekly trend direction for 1.00 Lot1
|
Crude Oil |
||||||
|
Pivot Points |
||||||
|
Profit or loss in $ |
10,700 |
6,700 |
3,700 |
-3,300 |
-4,300 |
-5,300 |
|
Profit or loss in €² |
8,941 |
5,598 |
3,092 |
-2,757 |
-3,593 |
-4,429 |
|
Profit or loss in £² |
7,745 |
4,849 |
2,678 |
-2,389 |
-3,112 |
-3,836 |
|
Profit or loss in C$² |
14,476 |
9,064 |
5,006 |
-4,465 |
-5,817 |
-7,170 |
- 1.00 lot is equivalent of 1000 units
- Calculations for exchange rate used as of 09:00 (GMT) 29/01/2026
There is a possibility to use Stop-Loss and Take-Profit.
- You may wish to consider closing your position in profit, even if it is lower than suggested one.
- Trailing stop technique could protect the profit.