GOLD weekly special report based on 1.00 Lot Calculation:
GEOPOLITICS: RUSSIA – USA/UKRAINE CONFLICT
- EVENT (FRIDAY, AUGUST 15): US PRESIDENT TRUMP SET TO MEET RUSSIA’S PRESIDENT PUTIN IN ALASKA, USA. If these ceasefire talks break down, it will increase geopolitical tensions, which in turn will increase safe-haven demand for Gold. Both presidents have agreed to hold a meeting on Friday (August 15), to discuss ways forward to end the war in Ukraine. Potential territory swaps are considered by the US administration. Ukraine’s president Zelensky, on the other hand, rejects giving up Ukrainian territory, or any deals which exclude Ukrainian presence at the table.
EVENTS:
- TUESDAY, AUGUST 12 AT 13:30 GMT+1: US INFLATION (CPI) (JULY). A lower than expected reading should be positive for Gold, because it could point to the FED cutting interest rates sooner and more aggresively. This index measures the change in the price of goods and services from the perspective of the consumer. The data for the previous month (June) came in at 2.7%.
- FRIDAY, AUGUST 15 AT 13:30 GMT+1: US RETAIL SALES (JULY). A lower than expected reading could prove positive for the price of Gold, because it could motivate the FED to cut interest rates to stimulate economic activity. This data measures the change in the total value of sales at the retail level. The number for the previous month (June) stood at 3.92%.
PRICE ACTION:
- GOLD HIT A NEW ALL-TIME HIGH OF $3,499.76 (April 22, 2025): Gold has traded around $3,350, and if a full recovery takes place, the price of Gold could rise around $150. Although the price could decline as well.
TECHNICAL ANALYSIS:
- SUPPORT AREA BETWEEN $3,300 AND $3,200: Gold prices have seen near-term support at $3,300, and an extended support level at $3,200, meaning the area between $3,300 and $3,200 altogether acts as a near-term support area. Gold prices have tested the area between $3,300 and $3,200 seven times since April 2025.
- LONG – TERM UPTREND: Gold has steadily kept above its long term dark blue trendline, indicating that Gold is in an uptrend since at least January 2025. The prices could also move in the opposite direction if the price goes below the long – term trendline.
- GOLD ABOVE ITS MOVING AVERAGES: Gold has kept above its 50 and 100 – Day Moving Averages, pointing to an uptred. The trend could reverse if Gold goes below these averages.
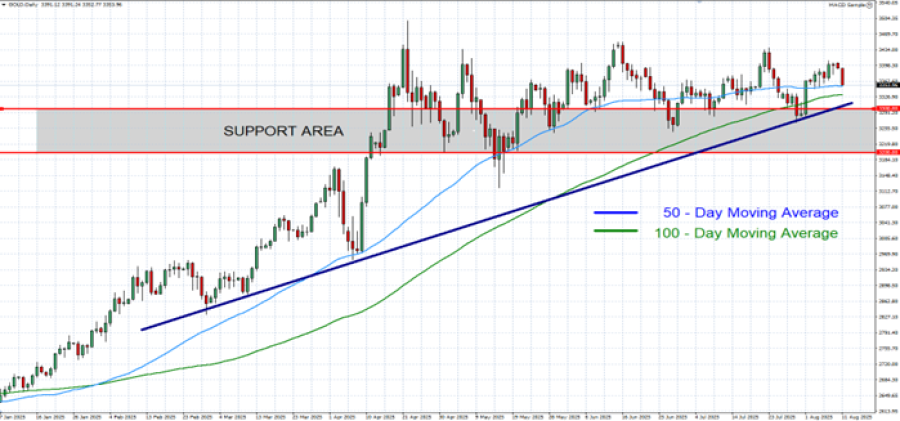
GRAPH (Daily): January 2025 – August 2025
Please note that past performance does not guarantee future results
GOLD, AUGUST 11, 2025.
Current Price: 3,350
|
GOLD |
Weekly |
|
Trend direction |
|
|
3,500 |
|
|
3,450 |
|
|
3,410 |
|
|
3,300 |
|
|
3,280 |
|
|
3,260 |
Example of calculation base on weekly trend direction for 1.00 Lot1
|
GOLD |
||||||
|
Pivot Points |
||||||
|
Profit or loss in $ |
15,000 |
10,000 |
6,000 |
-5,000 |
-7,000 |
-9,000 |
|
Profit or loss in €2 |
12,883 |
8,589 |
5,153 |
-4,294 |
-6,012 |
-7,730 |
|
Profit or loss in £2 |
11,149 |
7,433 |
4,460 |
-3,716 |
-5,203 |
-6,690 |
|
Profit or loss in C$2 |
20,650 |
13,766 |
8,260 |
-6,883 |
-9,636 |
-12,390 |
- 1.00 lot is equivalent of 100 units
- Calculations for exchange rate used as of 12:00 (GMT+1) 11/08/2025
There is a possibility to use Stop-Loss and Take-Profit.
- You may wish to consider closing your position in profit, even if it is lower than suggested one.
- Trailing stop technique could protect the profit.