GOLD weekly special report based on 1.00 Lot Calculation:
US FEDERAL RESERVE:
- BREAKING NEWS (SEPTEMBER 17): US FEDERAL RESERVE CUT ITS BENCHMARK INTEREST RATE TO 4.25% FROM THE PREVIOUS 4.50%. After some weak employment market data in August, July, and June, the US Federal Reserve decided to cut its benchmark interest rate in September and said it could cut rates further by 2025, expecting rates to fall to 3.75% by the end of 2025.
MARKET EXPECTATIONS (AFTER WEDNESDAY, SEPTEMBER 17): US FEDERAL RESERVE IS EXPECTED TO ANNOUNCE MORE INTEREST RATE CUTS BY THE END OF 2025 TO BRING RATES DOWN TOWARDS 3.75% (Source: https://www.cmegroup.com/markets/interest-rates/cme-fedwatch-tool.html)
TABLE (MOST RECENT INTEREST RATE DECISIONS): US FEDERAL RESERVE INTEREST RATE POLICY SINCE JULY 2024
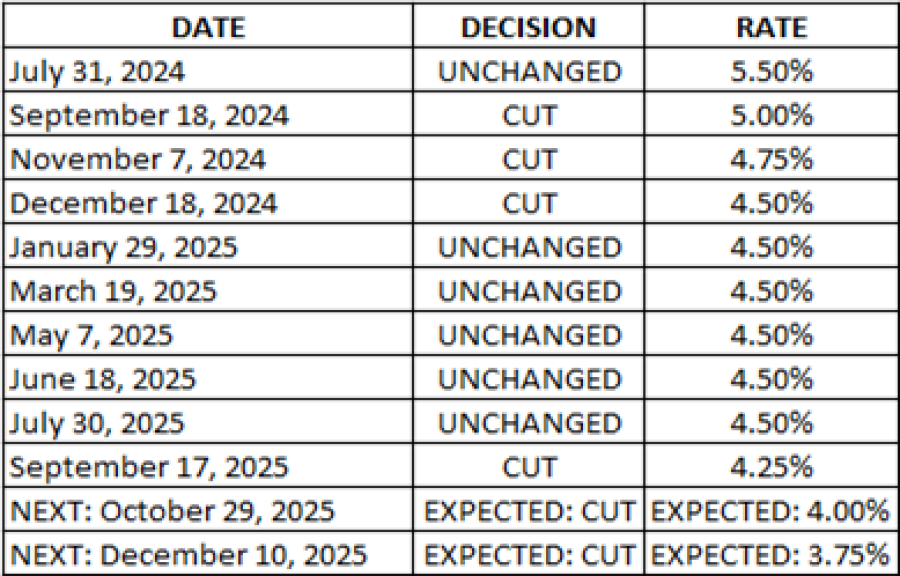
Data Source: Bloomberg Terminal; CMEGROUP.COM;
- STATISTICS (2000 - 2025): GOLD PRICE REACTION WITHIN 3, 6, 12 MONTHS AFTER THE FIRST RATE CUT BY THE FEDERAL RESERVE AS A NEW RATE CUT CYCLE BEGINS. Gold prices rose 3.61% on average within the first 3 months after the first rate cut of the cycle took place. Within the first 6 months, gold prices rose 16.01% on average. The gold price rose nearly 26% on average within the first 12 months after the first cut.
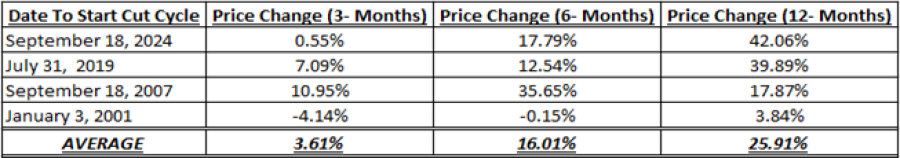
Date Source: Meta Trader 4
Please note that past performance does not guarantee future results
TECHNICAL ANALYSIS:
- PSYCHOLOGICAL SUPPORT: $3,600 - $3,500. After hitting fresh all-time highs ($3,707.2), gold prices have recently traded above the level of $3600, which has now become its next psychological support down to $3,500.
- UPTREND SINCE JANUARY 2025: Gold prices have been trading in an uptrend, as depicted by the daily chart below and the solid black uptrend line on the same chart. Since the beginning of January 2025, Gold prices have risen by around 40%.
- ANALYSTS’ OPINION: Deutsche Bank forecasts $4,000; Commerzbank forecasts $3,800; Goldman Sachs forecasts $4,000, but under certain circumstances, Goldman Sachs forecasts $5,000; Bank of America forecasts $4,000; J.P. Morgan forecasts $4,000.
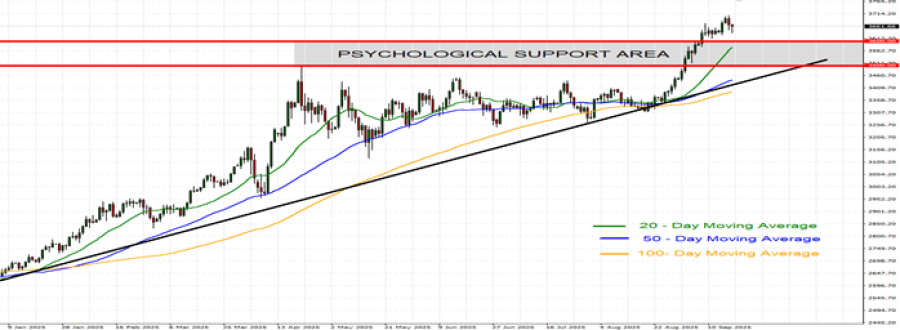
GRAPH (Daily): January 2025 – September 2025
Please note that past performance does not guarantee future results
GOLD, September 18, 2025.
Current Price: 3,655
|
GOLD |
Weekly |
|
Trend direction |
|
|
4,000 |
|
|
3,800 |
|
|
3,720 |
|
|
3,600 |
|
|
3,575 |
|
|
3,550 |
Example of calculation base on weekly trend direction for 1.00 Lot1
|
GOLD |
||||||
|
Pivot Points |
||||||
|
Profit or loss in $ |
34,500 |
14,500 |
6,500 |
-5,500 |
-8,000 |
-10,500 |
|
Profit or loss in €2 |
29,163 |
12,257 |
5,495 |
-4,649 |
-6,762 |
-8,876 |
|
Profit or loss in £2 |
25,295 |
10,631 |
4,766 |
-4,033 |
-5,866 |
-7,699 |
|
Profit or loss in C$2 |
47,532 |
19,977 |
8,955 |
-7,578 |
-11,022 |
-14,466 |
- 1.00 lot is equivalent of 100 units
- Calculations for exchange rate used as of 09:00 (GMT+1) 18/9/2025
There is a possibility to use Stop-Loss and Take-Profit.
- You may wish to consider closing your position in profit, even if it is lower than suggested one.
- Trailing stop technique could protect the profit.