GOLD weekly special report based on 1.00 Lot Calculation:
US FEDERAL RESERVE:
- BREAKING (WEDNESDAY, DECEMBER 10): US FEDERAL RESERVE CUT THEIR INTEREST RATE TO 3.75% FROM THE PREVIOUS 4.00%. This is their third consecutive rate cut, following those on September 17 and October 29, 2025. It marks the lowest rate since September 2022.
- EARLIER:
OCTOBER 29, 2025: US FEDERAL RESERVE CUT INTEREST RATE TO 4.00% FROM 4.25%.
SEPTEMBER 17, 2025: US FEDERAL RESERVE CUT INTEREST RATE TO 4.25% FROM 4.00%.
GOLD PRICE ACTION: LAST TWO TIMES TIME (SEPTEMBER AND OCTOBER): Following the last two interest rate cuts (September and October 2025) by the FED, gold rose on average by 4.53% after ten days and 10.79% after one month.
Data Source: MetaTrader 4 Platform
Please note that past performance does not guarantee future results
EVENTS
- TUESDAY, DECEMBER 16 AT 13:30 GMT: NONFARM PAYROLLS (NFP) AND UNEMPLOYMENT RATE (NOVEMBER). A weaker-than-expected NFP reading would point to a softer U.S. labor market, increasing expectations for additional Fed rate cuts. The U.S. unemployment rate has recently gone up to 4.4%, which is the highest rate since November 2021.
- THURSDAY, DECEMBER 18 AT 13:30 GMT: U.S. INFLATION (CPI) (NOVEMBER). A softer CPI reading would point to easing inflation and increase expectations for more Fed rate cuts, which typically support gold prices.
PRICE ACTION
- GOLD PRICE HIT A NEW ALL-TIME HIGH ON OCTOBER 20, 2025 ($4,381.34). Since the beginning of 2025, the gold price has been rising solidly, hitting a fresh all-time high in October ($4,381.34), marking an increase of around 67%. However, the price could also decline.
- ANALYSTS’ OPINION: Bank of America forecasts $5,000; Societe Generale forecasts $5,000; Standard Chartered forecasts $4,500; Goldman Sachs forecasts $4,900; J.P. Morgan forecasts $5,055; Morgan Stanley forecasts $4,400; HSBC forecasts $5,000; Deutsche Bank forecasts $4,450.
TECHNICAL ANALYSIS AND ANALYSTS’ OPINION:
- TECHNICAL SUPPORT: $4,200 - $4,100. Since late November, after the most recent decline in gold prices, gold prices have tried to maintain near-term support between $4,200 and $4,100.
- GOLD TRADING ABOVE MOVING AVERAGES (MA). Gold has kept steady above its 20 -, 50 -, and 100-day moving averages, pointing to an uptrend. However, it could also decline.
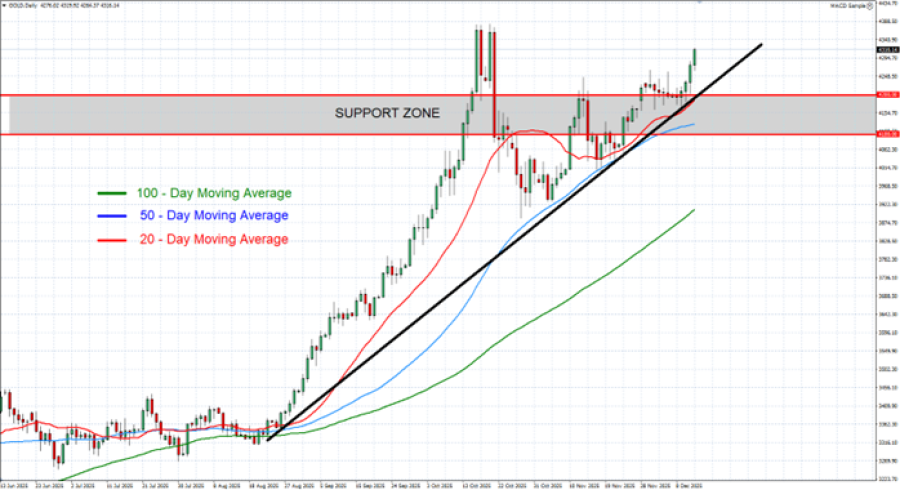
GRAPH (Daily): June 2025 – December 2025
Please note that past performance does not guarantee future results
GOLD, December 12, 2025.
Current Price: 4,320
|
GOLD |
Weekly |
|
Trend direction |
|
|
4,600 |
|
|
4,500 |
|
|
4,420 |
|
|
4,230 |
|
|
4,210 |
|
|
4,200 |
Example of calculation base on weekly trend direction for 1.00 Lot1
|
GOLD |
||||||
|
Pivot Points |
||||||
|
Profit or loss in $ |
28,000 |
18,000 |
10,000 |
-9,000 |
-11,000 |
-12,000 |
|
Profit or loss in €2 |
23,875 |
15,348 |
8,527 |
-7,674 |
-9,380 |
-10,232 |
|
Profit or loss in £2 |
20,931 |
13,455 |
7,475 |
-6,728 |
-8,223 |
-8,970 |
|
Profit or loss in C$2 |
38,521 |
24,764 |
13,758 |
-12,382 |
-15,133 |
-16,509 |
- 1.00 lot is equivalent of 100 units
- Calculations for exchange rate used as of 10:00 (GMT) 12/12/2025
There is a possibility to use Stop-Loss and Take-Profit.
- You may wish to consider closing your position in profit, even if it is lower than suggested one.
- Trailing stop technique could protect the profit.