GOLD weekly special report based on 1.00 Lot Calculation:
GEOPOLITICS: MIDDLE EAST WAR
- MIDDLE EAST WAR BEGAN. The war between the U.S. on one side and Iran on the other began on Saturday, February 28, with U.S. strikes on Iran that reportedly killed the Supreme Leader, Ayatollah Ali Khamenei. The war entered its fifth day on Wednesday (March 4), and according to U.S. officials, it could extend for another three to four weeks.
- IRAN RETALIATED. Iranian forces retaliated by firing missiles and targeting U.S. bases in the region. The Iranian missiles reportedly hit several countries in the region, such as the U.A.E., Bahrain, Qatar, Kuwait, Saudi Arabia, Jordan, Oman and Iraq.
EVENTS
- FRIDAY, MARCH 6 AT 13:30 GMT: US NON-FARM PAYROLLS AND UNEMPLOYEMNT RATE (FEBRUARY). One of the most important indicators in the U.S. labor market is employment data. If it shows a deteriorating situation (higher unemployment rates and lower numbers of newly employed workers), it could support gold prices, as it may motivate the U.S. Federal Reserve to cut interest rates in the near future. The number of newly employed workers was 130,000 last month, while the U.S. unemployment rate officially stands at 4.3%.
PRICE ACTION
- GOLD PRICE HIT A NEW ALL-TIME HIGH ON JANUARY 28, 2026 ($5,597.41). Gold currently trades around $5,170, and if it fully recovers to its previous all-time high, it could see an upside of around $430. However, the price could also decline.
- ANALYSTS’ OPINION: Wells Fargo forecasts $6,100; Bank of America forecasts $6,000; Goldman Sachs forecasts $5,400; Morgan Stanley forecasts $5,700; UBS forecasts $6,200; JPMorgan forecasts $6,300; Deutsche Bank forecasts $6,000; Societe General forecasts $6,000.
TECHNICAL ANALYSIS
- LONG-TERM TREND IS UP. The overall trend in gold remains upward, as indicated by the black trendline on the chart. The positive sentiment has strengthened significantly since mid-August 2025.
- SUPPORT AREA: $5,100 – $5,000. Gold prices have found a support zone in the range between $5,100 and $5,000. However, it could also decline.
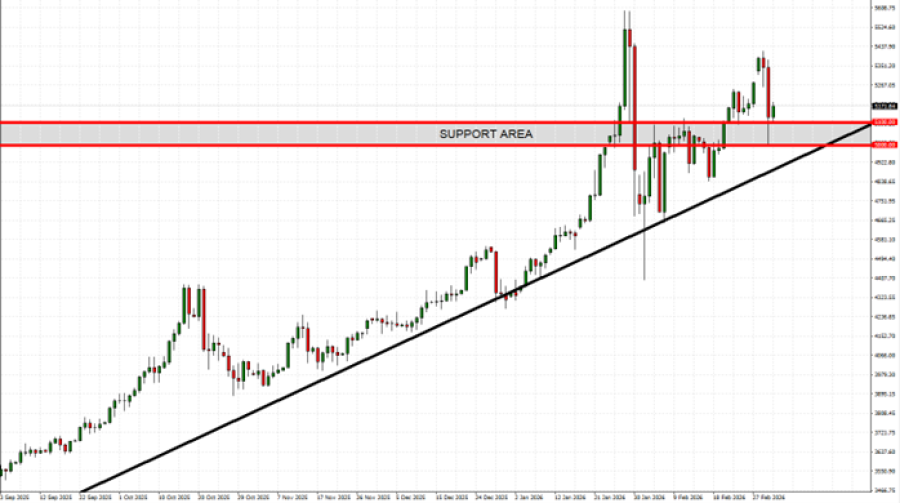
GRAPH (Daily): September 2025 – March 2026
Please note that past performance does not guarantee future results
GOLD, March 4, 2026
Current Price: 5,170
|
GOLD |
Weekly |
|
Trend direction |
|
|
6,000 |
|
|
5,600 |
|
|
5,400 |
|
|
5,000 |
|
|
4,950 |
|
|
4,900 |
Example of calculation base on weekly trend direction for 1.00 Lot1
|
GOLD |
||||||
|
Pivot Points |
||||||
|
Profit or loss in $ |
83,000 |
43,000 |
23,000 |
-17,000 |
-22,000 |
-27,000 |
|
Profit or loss in €2 |
71,465 |
37,024 |
19,804 |
-14,638 |
-18,943 |
-23,248 |
|
Profit or loss in £2 |
62,111 |
32,178 |
17,212 |
-12,722 |
-16,463 |
-20,205 |
|
Profit or loss in C$2 |
113,469 |
58,785 |
31,443 |
-23,241 |
-30,076 |
-36,912 |
- 1.00 lot is equivalent of 100 units
- Calculations for exchange rate used as of 09:30 (GMT) 04/03/2026
There is a possibility to use Stop-Loss and Take-Profit.
- You may wish to consider closing your position in profit, even if it is lower than suggested one.
- Trailing stop technique could protect the profit.