Natural Gas weekly special report based on 1.00 Lot Calculation:
GEOPOLITICS: MIDDLE EAST WAR
- BREAKING (FEBRUARY 28): MIDDLE EAST WAR BEGAN. The war between the U.S. and Iran on one side and Iran on the other side began on Saturday, February 2, with U.S. strikes on Iran, reportedly killing the Supreme Leader, Ayatollah Ali Khamenei.
- IRAN RETALIATED. Iranian forces retaliated by firing missiles and targeting U.S. bases in the region. The Iranian missiles reportedly hit several countries in the region, such as the U.A.E., Bahrain, Qatar, Kuwait, Saudi Arabia, Jordan and Iraq.
STRAIT OF HORMUZ CLOSED: CRITICAL LNG SUPPLY ROUTE AT RISK. Iranian forces have confirmed that the Strait of Hormuz is “closed,” with the Revolutionary Guards warning they will target any vessel attempting to transit the route. The Strait is a key energy chokepoint through which 20–25% of global LNG exports pass, mainly from Qatar. Any sustained disruption would severely tighten global LNG supply, significantly increasing risk premium and adding strong upside pressure to natural gas prices.
BREAKING (MARCH 02): QATAR PAUSES LNG PRODUCTION AMID ATTACKS ON ENERGY FACILITIES. Qatar, responsible for around 20% of global LNG exports, has reportedly stopped liquefied natural gas production after its Ministry of Defense confirmed that two major energy facilities were targeted by missile and drone attacks. As Qatar exports its LNG through the Strait of Hormuz, any sustained disruption to production or shipping would significantly tighten global LNG supply, sharply increasing upside risk for natural gas prices.
NATURAL GAS USE AND MARKET SHARE:
- NATURAL GAS is mainly used for electricity generation and heating. In the U.S., about 45% of homes use natural gas for heating.
- MARKET SHARE - PRODUCERS: BIGGEST NATURAL GAS PRODUCERS IN THE WORLD. The U.S. is the largest producer, with ~25% of the global market share, while Russia is the second with ~15% of the market. Iran is third with ~5%.
- MARKET SHARE - LNG (LIQUEFIED NATURAL GAS) EXPORTERS: The U.S. is the major LNG exporter, holding ~21% of the global market share, while Australia is the second with ~ 20% of the market. Qatar is third with ~20% and Russia fourth with ~ 8% of the global market.
- MARKET SHARE - LNG- LIQUEFIED NATURAL GAS IMPORTERS: China is the world's largest LNG importer, with ~19-23.5% of global imports, Japan is second with ~ 16%- 18%, and the EU ~14%-15%. (Source: IEA)
EUROPE: NATURAL GAS STORAGE HAS DECLINED TO 30.05% OF CAPACITY
- EUROPEAN NATURAL GAS STORAGE IS 34% BELOW THE 5-YEAR AVERAGE. Natural gas storage levels in Europe have continued to decline, falling below the five-year average and approaching levels last seen in April 2022. A stronger refilling season could be ahead in 2026. After cutting itself off from Russian natural gas, Europe has recently reached an agreement with the United States to increase purchases of liquefied natural gas (LNG).
EVENTS
- THURSDAY, MARCH 05 AT 15:30 GMT: U.S. WEEKLY NATURAL GAS STORAGE DATA. U.S. natural gas inventories have declined for the past 14 consecutive weeks, confirming tightening market fundamentals.
TECHNICAL ANALYSIS
- BREAKING (FEBRUARY 26): NATURAL GAS PRICE HAS HIT ITS LOWEST RATE SINCE AUGUST 2025 ($2.769).
- SUPPORT AREA: $3. Natural gas has maintained strong support near $3 since late 2024, testing the area eight times and confirming it as a solid support zone. This is the nineth time to trade near the mark of $3. However, it could also decline.
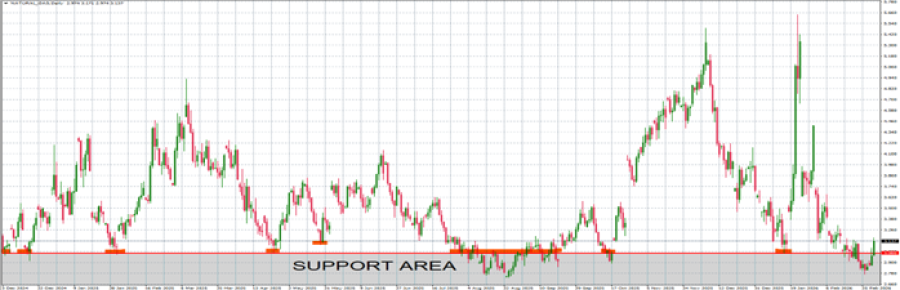
GRAPH (Daily): November 2024 – February 2026
Please note that past performance does not guarantee future results
Natural Gas, March 03, 2026
Current Price: 3.1
|
NATURAL GAS |
Weekly |
|
Trend direction |
|
|
6.000 |
|
|
4.500 |
|
|
3.600 |
|
|
2.800 |
|
|
2.750 |
|
|
2.700 |
Example of calculation based on weekly trend direction for 1.00 Lot1
|
NATURAL GAS |
||||||
|
Pivot Points |
||||||
|
Profit or loss in $ |
29,000 |
14,000 |
5,000 |
-3,000 |
-3,500 |
-4,000 |
|
Profit or loss in €² |
24,989 |
12,064 |
4,309 |
-2,585 |
-3,016 |
-3,447 |
|
Profit or loss in £² |
21,795 |
10,522 |
3,758 |
-2,255 |
-2,630 |
-3,006 |
|
Profit or loss in C$² |
39,723 |
19,177 |
6,849 |
-4,109 |
-4,794 |
-5,479 |
- 1.00 lot is equivalent of 10,000 units
- Calculations for exchange rate used as of 10:10 (GMT) 03/03/2026
There is a possibility to use Stop-Loss and Take-Profit.
- You may wish to consider closing your position in profit, even if it is lower than the suggested one.
- Trailing stop techniques could protect the profit.