Palladium weekly special report based on 1.00 Lot Calculation:
PALLADIUM USE AND MARKET SHARE:
- Palladium is mostly used in catalytic converters by the car industry to reduce harmful gas emissions, while tightening regulations are forcing automakers to put more Palladium into each vehicle, which in turn could keep the demand outlook positive. Palladium has also been used in fuel cells to generate power.
- MARKET SHARE (PRODUCERS): Russia is the largest producer, holding 43% of the market, while South Africa is the second largest with 33.00% of the market. Canada is third on the list with 9.5% of the global production.
- MARKET SHARE (CONSUMERS): China is the largest Palladium consumer with 31%, while Europe and North America (USA) hold 20% each. Japan stands at 11%.
EVENTS:
- THURSDAY, DECEMBER 18 AT 13:30 GMT: US INFLATION (CPI) (NOVEMBER). A weaker CPI reading would reinforce expectations for additional Fed cuts. A softer dollar and easier financial conditions generally improve sentiment toward commodities like palladium.
- TUESDAY, DECEMBER 23 AT 14:15 GMT: US INDUSTRIAL PRODUCTION (OCTOBER). Stronger industrial production would signal improving manufacturing activity, which directly boosts demand for palladium in catalytic converters and can support higher prices. This kind of data often reinforces expectations of steady industrial consumption, adding upward pressure to palladium.
- WEDNESDAY, DECEMBER 31 AT 1:30 GMT: CHINA MANUFACTURING PURCHASING MANAGERS INDEX (PMI) (DECEMBER). A stronger-than-expected PMI reading would signal improving factory activity in China, the world’s largest consumer of palladium. Rising manufacturing momentum would point to firmer industrial and automotive demand, supporting a bullish outlook for palladium prices.
GEOPOLITICS: RUSSIA-UKRAINE PEACE DEAL UNCERTAINTY
- UKRAINE–USA TALKS SHOW NO BREAKTHROUGH, KEEPING PALLADIUM SUPPLY RISKS HIGH. Ukrainian President Zelensky said a revised peace proposal could be presented to Russia within days, but stressed that key issues, especially territorial control, remain unresolved. While the U.S. has offered security guarantees, Russia has not signaled acceptance, and Ukraine continues to reject any territorial concessions. With negotiations ongoing and major differences still in place, the likelihood of a near-term peace deal remains low. For palladium, where Russia is the world’s largest producer, prolonged geopolitical uncertainty sustains supply risk and supports further upside in prices. There have already been similar proposals throughout 2025, and all of them ended with no agreement.
LAST TIME (OCTOBER): TRUMP–PUTIN CALL ON OCTOBER 16, 2025. The call led to a potential new summit between US President Trump and Russian President Putin, but due to further disagreements, the summit never happened, and Trump announced sanctions on Russia’s Lukoil and Rosneft on October 22.
RUSSIA IS THE LARGEST PRODUCER OF PALLADIUM IN THE WORLD (43% OF TOTAL GLOBAL SUPPLY).
RUSSIA IS THE LARGEST EXPORTER OF PALLADIUM IN THE WORLD (23% OF TOTAL GLOBAL EXPORTS).
TECHNICAL ANALYSIS:
- UPTREND SINCE AUGUST 2025: As shown in the daily chart below, the price of palladium has been in a steady uptrend, supported by a rising uptrend channel since August 2025. However, the price could decline.
- SUPPORT: $1,600 - $1,650. This zone represents an important psychological support area for palladium prices.
- PALLADIUM PRICE ABOVE 20-,50-, AND 100-DAILY MOVING AVERAGES: Palladium price has remained above its 20-, 50-, and 100-day moving averages, indicating a potential uptrend. The trend could reverse if Palladium price goes below these averages.
- PALLADIUM HIT AN ALL-TIME HIGH OF $3,409 (March 2022): Palladium price has traded around $1,700, and if a full recovery takes place, the price of palladium could see an upside of around 100%. Although the price could decline as well.
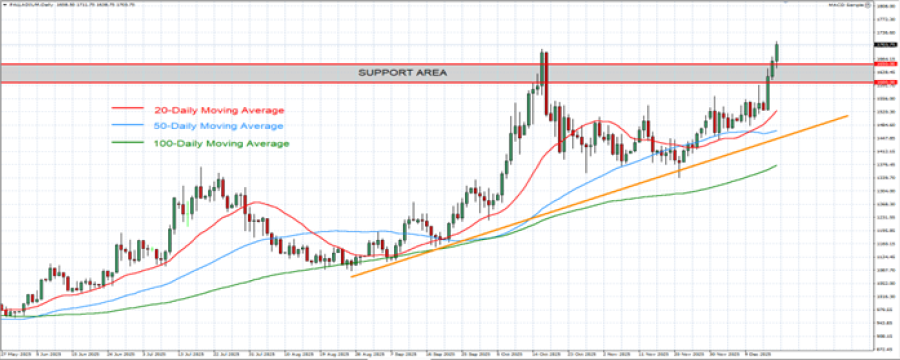
GRAPH (Daily): May 2025 – December 2025
Please note that past performance does not guarantee future results
Palladium, December 17, 2025.
Current Price: 1,700
|
PALLADIUM |
Weekly |
|
Trend direction |
|
|
2,000 |
|
|
1,900 |
|
|
1,800 |
|
|
1,610 |
|
|
1,600 |
|
|
1,590 |
Example of calculation based on weekly trend direction for 1.00 Lot1
|
PALLADIUM |
||||||
|
Pivot Points |
||||||
|
Profit or loss in $ |
30,000 |
20,000 |
10,000 |
-9,000 |
-10,000 |
-11,000 |
|
Profit or loss in €² |
25,592 |
17,061 |
8,531 |
-7,678 |
-8,531 |
-9,384 |
|
Profit or loss in £² |
22,502 |
15,001 |
7,501 |
-6,750 |
-7,501 |
-8,251 |
|
Profit or loss in C$² |
41,350 |
27,566 |
13,783 |
-12,405 |
-13,783 |
-15,162 |
- 1.00 lot is equivalent of 100 units
- Calculations for exchange rate used as of 10:30 (GMT) 17/12/2025
There is a possibility to use Stop-Loss and Take-Profit.
- You may wish to consider closing your position in profit, even if it is lower than suggested one.
- Trailing stop technique could protect the profit.