GOLD
November 4, 2026
Risk Disclaimer: The example below is for illustrative purposes only and is based on price movements derived from Contracts for Difference (CFDs). The calculations reflect hypothetical outcomes using historical or specified price data for the relevant instrument on the stated date and are not indicative of future performance. Any reliance placed on this material is strictly at the user’s own risk.
Weekly Special Report: Gold
TECHNICAL ANALYSIS:
GOLD: OCTOBER 2025 – NOVEMBER 2026 PRICE REVIEW
- GOLD PRICE TESTED LEVELS BELOW $4000: 7 times between October 2025 and November 2026. On October 30, gold tested levels below $4,000 for the eighth time.
- AVERAGE PRICE LOW: $3,959.45.
- AVERAGE PRICE HIGH: $4,291.10.
- AVERAGE TIME TO RECOVER FROM LOW TO HIGH: 14.1 days
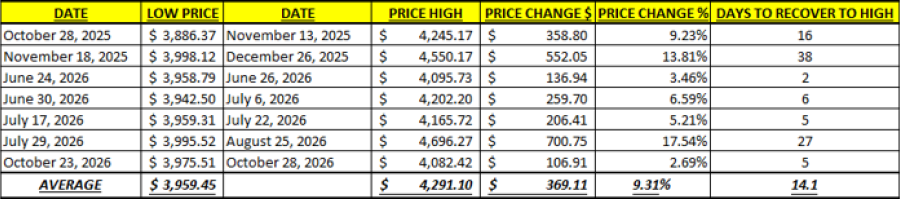
Data Source: MetaTrader 4
Please note that past performance does not guarantee future results
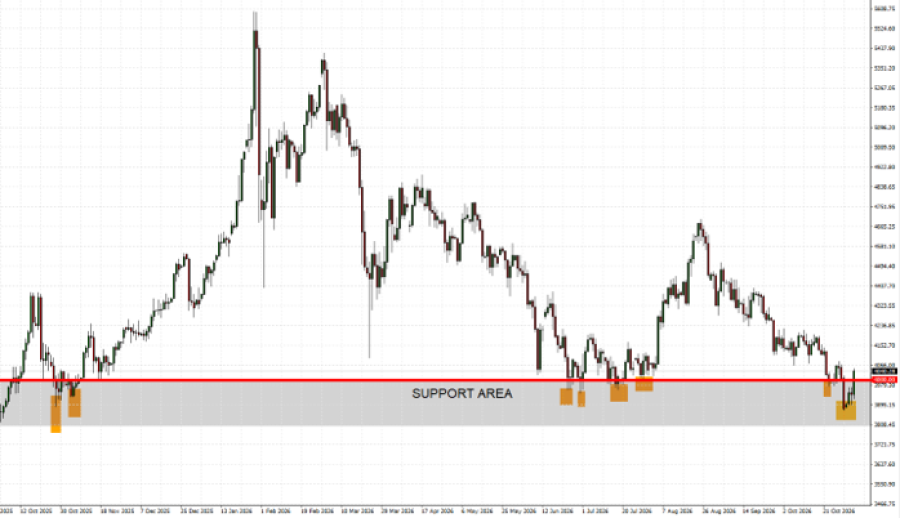
GRAPH (Daily): October 2025 – November 2026
Please note that past performance does not guarantee future results
U.S. MIDTERM ELECTIONS:
- BREAKING (NOVEMBER 3): U.S. DEMOCRATS WIN CONTROL OF BOTH CHAMBERS OF CONGRESS. Democrats secured major victories in the U.S. midterm elections, taking control of both the House of Representatives and the Senate and ending Republican control of Congress. This creates a divided government under President Trump, potentially increasing political uncertainty and making it harder to pass new legislation.
- EVENT (FRIDAY, DECEMBER 11): U.S. GOVERNMENT FACES ANOTHER SHUTDOWN DEADLINE. President Trump signed a temporary funding bill in September, keeping the government operational until December 11, 2026. Congress must reach a new funding agreement before then to avoid another shutdown.
- GOLD PRICE PERFORMANCE DURING THE 2025 U.S. GOVERNMENT SHUTDOWN. During the last full U.S. government shutdown, which lasted 43 days (October 1 – November 12, 2025), gold prices rose by $382.04 (+11.0%) in the month before, $340.22 (+8.8%) during the shutdown, and $103.70 (+2.5%) in the month after.
Source: Investing, Reuters
Please note that past performance does not guarantee future results
ECONOMIC DATA
- FRIDAY, NOVEMBER 6, AT 13:30 GMT: U.S. NONFARM PAYROLLS AND UNEMPLOYMENT RATE (OCTOBER). Investors will closely watch the U.S. labor market after September’s weak employment data, when nonfarm payrolls (NFP) increased by just 29,000 vs. 89,000 expected.
PRICE ACTION
- FORECAST: Wells Fargo forecasts $4,900; Bank of America forecasts $4,750; Goldman Sachs forecasts $4,900; Morgan Stanley forecasts $5,050; UBS forecasts $5,000; JPMorgan forecasts $4,500; Deutsche Bank forecasts $4,600; Citigroup forecasts $5,000; Societe General forecasts $5,000.
Gold, November 4, 2026
Current Price: 4,030
|
GOLD |
Weekly |
|
Market Trend |
|
|
4,300 |
|
|
4,200 |
|
|
4,130 |
|
|
3,940 |
|
|
3,920 |
|
|
3,900 |
Example of calculation based on weekly market trend for 1.00 Lot1
|
GOLD |
||||||
|
Pivot Points |
||||||
|
Profit or loss in $ |
27,000 |
17,000 |
10,000 |
-9,000 |
-11,000 |
-13,000 |
|
Profit or loss in €² |
24,008 |
15,116 |
8,892 |
-8,003 |
-9,781 |
-11,560 |
|
Profit or loss in £² |
20,032 |
12,612 |
7,419 |
-6,677 |
-8,161 |
-9,645 |
|
Profit or loss in C$² |
37,687 |
23,729 |
13,958 |
-12,562 |
-15,354 |
-18,145 |
- The above calculations are made based on 1.00 lot which is equivalent of 100 units
- Calculations for exchange rate used as of 10:30 (GMT) 04/11/2026
You can use risk management tools such as Stop-Loss and Take-Profit.


