USD/CAD
September 29, 2026
Risk Disclaimer: The example below is for illustrative purposes only and is based on price movements derived from Contracts for Difference (CFDs). The calculations reflect hypothetical outcomes using historical or specified price data for the relevant instrument on the stated date and are not indicative of future performance. Any reliance placed on this material is strictly at the user’s own risk.
Weekly Special Report: USD/CAD
EVENTS (U.S.):
- WEDNESDAY, SEPTEMBER 30 AT 13:15 GMT+1: U.S. ADP EMPLOYMENT CHANGE (SEPTEMBER). Private sector employment came in lower than expected in August. Another weak reading could signal a slowing U.S. labor market, reducing expectations of further Fed interest rate hikes and weakening the U.S. dollar.
- WEDNESDAY, SEPTEMBER 30 AT 13:30 GMT+1: U.S. CORE PCE INFLATION (AUGUST). Core PCE, the Fed’s preferred inflation measure, remained at 3.3% year over year in July. A lower-than-expected reading could reduce expectations of further Fed interest rate hikes, weighing on the U.S. dollar.
- FRIDAY, OCTOBER 2 AT 13:30 GMT+1: U.S. NONFARM PAYROLLS (NFP) AND UNEMPLOYMENT RATE (SEPTEMBER). The U.S. labor market has shown a clear weakening trend over the past few years, with slower job creation and unemployment currently at 4.1%. The labor market will remain a key focus, and further weakness could reduce expectations of interest rate hikes, weighing on the U.S. dollar.
EVENTS (CANADA):
- FRIDAY, OCTOBER 9 AT 13:30 GMT+1: CANADA UNEMPLOYMENT RATE (SEPTEMBER). The unemployment rate in Canada has remained at 6.4% since July.
TECHNICAL ANALYSIS
- RESISTANCE AREA: 1.4400 - 1.4250. USD/CAD has recently approached its longer-term resistance area of 1.4400–1.4250, which has been in place for almost two years. However, there remains a risk of a potential breakout below this level if market conditions change.
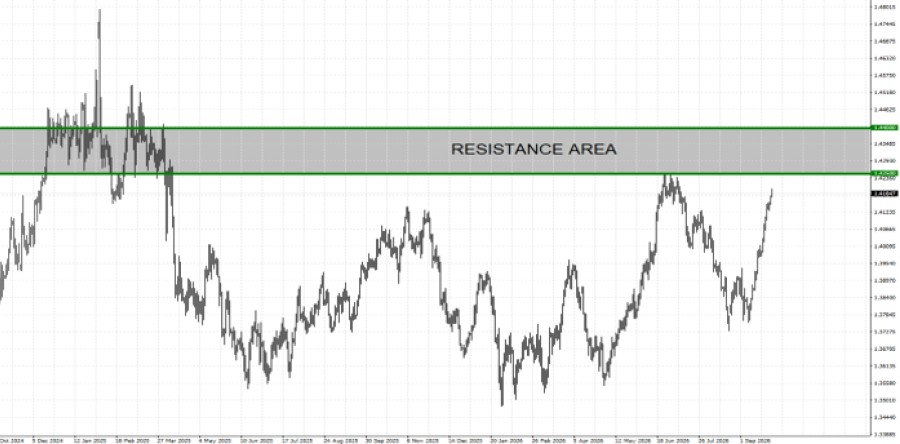
GRAPH (Daily): October 2024– September 2026
Please note that past performance does not guarantee future results
USDCAD, September 29, 2026
Current Price: 1.4180
|
USD/CAD |
Weekly |
|
Market Trend |
|
|
1.4400 |
|
|
1.4375 |
|
|
1.4350 |
|
|
1.4000 |
|
|
1.3900 |
|
|
1.3750 |
Example of calculation based on weekly market trend for 1.00 Lot1
|
USD/CAD |
||||||
|
Pivot Points |
||||||
|
Profit or loss in $ |
-1,552 |
-1,375 |
-1,199 |
1,270 |
1,975 |
3,033 |
|
Profit or loss in €² |
-1,367 |
-1,212 |
-1,056 |
1,118 |
1,740 |
2,672 |
|
Profit or loss in £² |
-1,172 |
-1,038 |
-905 |
959 |
1,491 |
2,290 |
|
Profit or loss in C$² |
-2,200 |
-1,950 |
-1,700 |
1,800 |
2,800 |
4,300 |
- The above calculations are made based on 1.00 lot which is equivalent of 100,000 units
- Calculations for exchange rate used as of 13:00 (GMT+1) 29/09/2026
You can use risk management tools such as Stop-Loss and Take-Profit.


