USD/JPY
September 15, 2026
Risk Disclaimer: The example below is for illustrative purposes only and is based on price movements derived from Contracts for Difference (CFDs). The calculations reflect hypothetical outcomes using historical or specified price data for the relevant instrument on the stated date and are not indicative of future performance. Any reliance placed on this material is strictly at the user’s own risk.
Weekly Special Report: USD/JPY
U.S. FEDERAL RESERVE (FED):
- WEDNESDAY, SEPTEMBER 16 AT 19:00 GMT+1: U.S. FEDERAL RESERVE (FED) INTEREST RATE DECISION. The Fed interest rate currently stands at 3.75%, and many market participants expect an increase to 4%. However, if the Fed decides to keep rates unchanged at 3.75%, this could put negative pressure on the US dollar and the USD/JPY prices.
PRESS CONFERENCE (FED CHAIR KEVIN WARSH) AT 19:30 GMT+1. Investors will closely watch Warsh’s comments on inflation, the economy and future interest rates. If Warsh signals that further rate increases are unlikely, this could weigh on the U.S. dollar and push the USD/JPY lower.
BANK OF JAPAN (BOJ):
- FRIDAY, SEPTEMBER 18 AT 04:00 GMT+1: BANK OF JAPAN (BOJ) INTEREST RATE DECISION. The BOJ is widely expected to raise rates by 25 basis points in September, from the current rate of 1.00% to 1.25%. This would push rates to their highest level since 1995. The bank is also expected to announce plans for further rate increases in 2026 and 2027. Expectations of further BOJ rate hikes could support the Japanese yen and put further negative pressure on the USD/JPY.
EVENTS (U.S.A):
- WEDNESDAY, SEPTEMBER 16 AT 13:30 GMT+1: U.S. RETAIL SALES (AUGUST). Investors will closely watch U.S. Retail Sales after July's reading unexpectedly declined, raising concerns about slowing consumer spending. Another weak report could reduce expectations of Federal Reserve interest rate hikes, weighing on the U.S. dollar and the USD/JPY price.
- THURSDAY, SEPTEMBER 17 AT 13:30 GMT+1: U.S. WEEKLY INITIAL JOBLESS CLAIMS. A higher-than-expected reading could indicate further weakness in the U.S. labor market, weighing on the U.S. dollar and the USD/JPY price.
TECHNICAL ANALYSIS:
- STRONG RESISTANCE: 160. The 160 and above area has remained a strong resistance zone since April 2024, having been tested only a few times. The 160 level has become a major resistance zone following the latest Bank of Japan and U.S.–Japan joint intervention. A sustained break above 160 could trigger renewed intervention risks as Japan looks to prevent further yen weakness. However, the pair could also rise further.
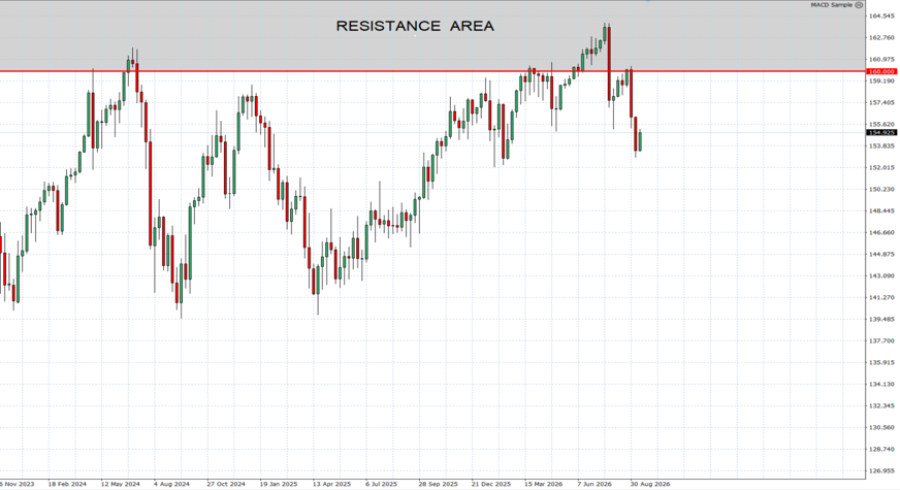
GRAPH (Weekly): November 2023 – September 2026
Please note that past performance does not guarantee future results
USD/JPY, September 15, 2026
Current Price: 154.90
|
USD/JPY |
Weekly |
|
Market Trend |
|
|
158.50 |
|
|
158.00 |
|
|
157.50 |
|
|
152.00 |
|
|
151.00 |
|
|
150.00 |
Example of calculation based on weekly market trend for 1.00 Lot1
|
USD/JPY |
||||||
|
Pivot Points |
||||||
|
Profit or loss in $ |
-2,323.54 |
-2,000.83 |
-1,678.11 |
1,871.74 |
2,517.17 |
3,162.60 |
|
Profit or loss in €2 |
-2,012.79 |
-1,733.24 |
-1,453.69 |
1,621.42 |
2,180.53 |
2,739.64 |
|
Profit or loss in £2 |
-1,723.41 |
-1,484.05 |
-1,244.69 |
1,388.31 |
1,867.03 |
2,345.76 |
|
Profit or loss in C$2 |
-3,236.15 |
-2,786.69 |
-2,337.22 |
2,606.90 |
3,505.83 |
4,404.76 |
- The above calculations are made based on 1.00 lot which is equivalent of 100,000 units
- Calculations for exchange rate used as of 14:00 (GMT+1) 15/09/2026
You can use risk management tools such as Stop-Loss and Take-Profit


