CRUDE OIL
November 13, 2026
Risk Disclaimer: The example below is for illustrative purposes only and is based on price movements derived from Contracts for Difference (CFDs). The calculations reflect hypothetical outcomes using historical or specified price data for the relevant instrument on the stated date and are not indicative of future performance. Any reliance placed on this material is strictly at the user’s own risk.
Weekly Special Report: CRUDE OIL
MIDDLE EAST CONFLICT: RENEWED ESCALATION RISKS AND THREATS TO GLOBAL OIL SUPPLIES
- BREAKING (NOVEMBER 12): US PRESIDENT TRUMP INDICATES A SHIFT AWAY FROM DIPLOMACY WITH IRAN. President Donald Trump stated that the United States no longer needs a diplomatic agreement with Iran, claiming Washington has secured control over Iranian financial resources and the Strait of Hormuz. He also redirected Vice President JD Vance towards domestic issues and warned that further military strikes against Iran remain possible.
- BREAKING (NOVEMBER 9 – 13): U.S. MILITARY REINFORCEMENTS IN THE MIDDLE EAST AS THIRD AIRCRAFT CARRIER ARRIVES SOON. The USS Theodore Roosevelt (CVN-71) departed Singapore on November 9 and is heading towards the Middle East, joining the USS George H.W. Bush and USS George Washington. The deployment also includes an amphibious group and approximately 2,200 Marines, bringing total U.S. reinforcements to an estimated 9,000–10,000 additional personnel.
- BREAKING (NOVEMBER 9–13): HOUTHI ATTACKS ON SAUDI ARABIA INCREASE RISKS TO OIL INFRASTRUCTURE. Iran-backed Houthi forces have intensified attacks on Saudi Arabia, targeting the East-West oil pipeline, oil facilities and Aramco sites. The attacks threaten a key route carrying more than 4 million barrels of Saudi crude oil per day to the Red Sea, bypassing the Strait of Hormuz.
TECHNICAL ANALYSIS:
- RESISTANCE AREA: $94–$100. Since the beginning of the Middle East War, crude oil has tested the $100 level or above on 12 occasions. Historically, the subsequent decline has taken prices down to around $87, which represents the average support level. Following a test of this average support level, crude oil has historically rebounded towards $100 or above within an average of approximately 9 days. However, the price can also decline.
- SUPPORT AREA: $82–$80. Crude oil's next important support area is between $82 and $80, which was last tested in late August of 2026.
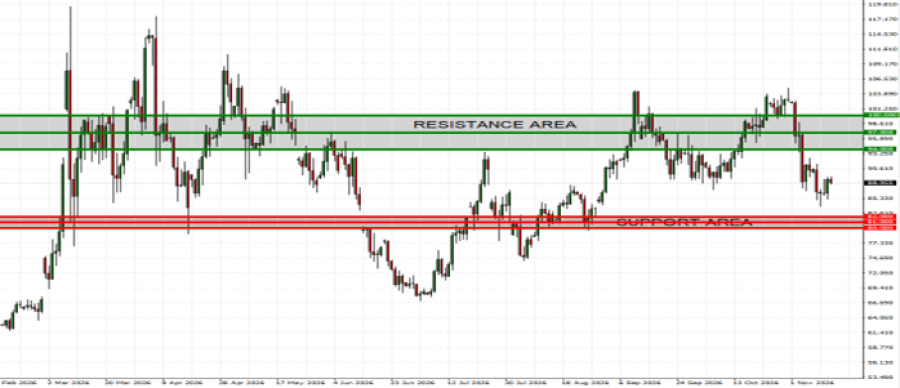
GRAPH (Daily): February 2026 – November 2026
Please note that past performance does not guarantee future results
Crude Oil, November 13, 2026
Current Price: 87.90
|
Crude Oil |
Weekly |
|
Market Trend |
|
|
100 |
|
|
97 |
|
|
94 |
|
|
82 |
|
|
81 |
|
|
80 |
Example of calculation based on weekly market trend for 1.00 Lot1
|
CRUDE OIL |
||||||
|
Pivot Points |
||||||
|
Profit or loss in $ |
12,100 |
9,100 |
6,100 |
-5,900 |
-6,900 |
-7,900 |
|
Profit or loss in €2 |
10,950 |
8,235 |
5,520 |
-5,339 |
-6,244 |
-7,149 |
|
Profit or loss in £2 |
9,151 |
6,882 |
4,613 |
-4,462 |
-5,218 |
-5,975 |
|
Profit or loss in C$2 |
17,260 |
12,981 |
8,701 |
-8,416 |
-9,843 |
-11,269 |
- The above calculations are made based on 1.00 lot which is equivalent of 1,000 units
- Calculations for exchange rate used as of 10:30 (GMT) 13/11/2026
You can use risk management tools such as Stop-Loss and Take-Profit.


