NATURAL GAS
October 8, 2026
Risk Disclaimer: The example below is for illustrative purposes only and is based on price movements derived from Contracts for Difference (CFDs). The calculations reflect hypothetical outcomes using historical or specified price data for the relevant instrument on the stated date and are not indicative of future performance. Any reliance placed on this material is strictly at the user’s own risk.
Weekly Special Report: Natural Gas
NATURAL GAS: USE AND MARKET SHARE
- NATURAL GAS is mainly used for electricity generation in the U.S. Natural gas power plants supplied roughly 42%–46% of U.S. electricity during recent summers, largely because of air conditioning demand.
- MARKET SHARE (PRODUCERS): BIGGEST NATURAL GAS PRODUCERS IN THE WORLD. The U.S. is the largest producer, accounting for around 25% of global natural gas production, while Russia ranks second with about 15%. Qatar contributes roughly 4–5%, while Iran accounts for approximately 6-7% of total global production.
- MARKET SHARE (TOTAL NATURAL GAS + LNG IMPORTERS): China is the world’s largest importer, accounting for approximately 20% of global imports, followed by Japan with around 16–18%. The European Union represents the largest bloc, accounting for roughly 27% of total natural gas imports.
Sources: EIA
NATURAL GAS: NEWS
- BREAKING (OCTOBER 8): HURRICANE ISAIAS THREATENS U.S. NATURAL GAS PRODUCTION IN THE GULF OF MEXICO. Isaias has strengthened into a Category 1 hurricane and is expected to strengthen further before reaching the U.S. Gulf Coast late Friday (October 9) or early Saturday (October 10). The Gulf of Mexico accounts for around 5% of total U.S. natural gas production.
16.4% OF GULF OF MEXICO NATURAL GAS PRODUCTION ALREADY SHUT DOWN. Energy companies, including Shell and Chevron, have begun evacuating personnel and suspending offshore operations ahead of the hurricane. Around 16.4% of the region’s natural gas production has already been shut down, with further disruptions potentially reducing U.S. natural gas supply and supporting higher prices.
NATURAL GAS STORAGE: EUROPE
- EUROPEAN GAS STORAGE REMAINS WELL BELOW NORMAL LEVELS. EU storage levels are around 72.97% full, up around 45% from early April but still well below the five-year average of around 85% and at their lowest level this time of the year in 15 years. Europe purchases more than 50% of its LNG (Liquified Natural Gas) imports from the U.S., making American natural gas an important source of supply.
EUROPEAN DEMAND FOR U.S. NATURAL GAS COULD INCREASE AHEAD OF WINTER. With European gas inventories significantly below normal levels, countries may need to increase LNG imports from the U.S. ahead of the winter heating season. Stronger European demand could boost U.S. LNG exports and support higher U.S. natural gas prices.
TECHNICAL ANALYSIS
- SUPPORT AREA: $3.00 - $2.70. Natural gas prices have maintained a key support area between $3.00 and $2.70 since October 2024, repeatedly rebounding from this range. Prices have recently rebounded once again from this support area and are now trading above $3.00, reinforcing the importance of this zone. Holding above it could support further upside. However, prices could also decline.
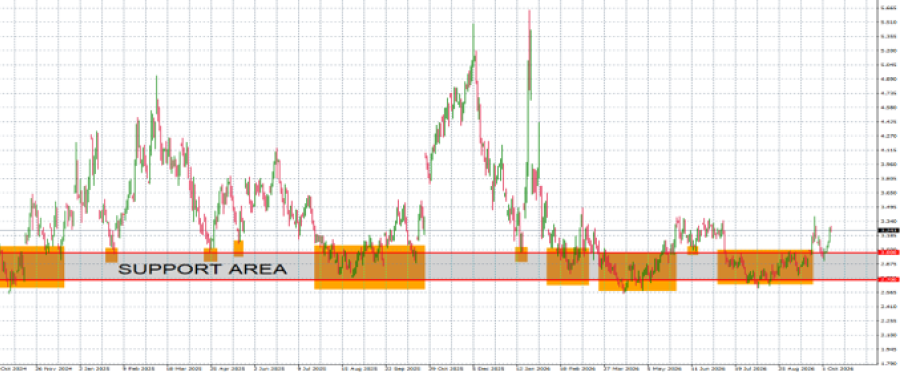
GRAPH (Daily): October 2024 - October 2026
Please note that past performance does not guarantee future results
Natural Gas, October 8, 2026
Current Price: 3.240
|
Natural Gas |
Weekly |
|
Market Trend |
|
|
4.000 |
|
|
3.700 |
|
|
3.500 |
|
|
3.000 |
|
|
2.950 |
|
|
2.900 |
Example of calculation based on weekly market trend for 1.00 Lot1
|
NATURAL GAS |
||||||
|
Pivot Points |
||||||
|
Profit or loss in $ |
7,600 |
4,600 |
2,600 |
-2,400 |
-2,900 |
-3,400 |
|
Profit or loss in €² |
6,798 |
4,115 |
2,326 |
-2,147 |
-2,594 |
-3,041 |
|
Profit or loss in £² |
5,759 |
3,485 |
1,970 |
-1,819 |
-2,197 |
-2,576 |
|
Profit or loss in C$² |
10,844 |
6,564 |
3,710 |
-3,424 |
-4,138 |
-4,851 |
- The above calculations are made based on 1.00 lot which is equivalent of 10,000 units
- Calculations for exchange rate used as of 12:55 (GMT+1) 08/10/2026
You can use risk management tools such as Stop-Loss and Take-Profit


