AUD/USD
September 22, 2026
Risk Disclaimer: The example below is for illustrative purposes only and is based on price movements derived from Contracts for Difference (CFDs). The calculations reflect hypothetical outcomes using historical or specified price data for the relevant instrument on the stated date and are not indicative of future performance. Any reliance placed on this material is strictly at the user’s own risk.
Weekly Special Report: AUD/USD
U.S. – CHINA SUMMIT
- EVENT (SEPTEMBER 23 – SEPTEMBER 25): U.S. – CHINA SUMMIT. Chinese President Xi Jinping is scheduled to visit the United States from September 23–25, with the main meeting with U.S. President Donald Trump expected on Thursday, September 24, at the White House. Key topics are expected to include trade and tariffs, rare-earth exports, A.I., Taiwan, Iran and broader U.S.–China relations.
- ANALYSIS: CHINA IS AUSTRALIA’S LARGEST TRADING PARTNER. In 2025, China accounted for around 25% of Australia’s total trade, with two-way trade valued at approximately A$326 billion. Australia exported around A$196 billion in goods and services to China, representing 29% of its total exports. Australia’s major exports to China include iron ore, natural gas, gold and agricultural products.
Source: White House, Reuters, CNN, Australian Government data DFAT
RESERVE BANK OF AUSTRALIA (RBA):
- TUESDAY, SEPTEMBER 29 AT 05:30 GMT+1: RESERVE BANK OF AUSTRALIA (RBA) INTEREST RATE DECISION. The RBA is widely expected to raise its cash rate by 25 basis points to 4.60%, following stronger-than-expected inflation and continued price pressures. Higher energy prices and persistent domestic demand have increased concerns that inflation could remain above the RBA’s 2%–3% target range for longer. A potential rate hike by the RBA could support the Australian dollar and the AUD/USD pair.
U.S. GOVERNMENT:
- BREAKING (SEPTEMBER 10): U.S. TREASURY BEGAN ITS STIMULUS-LIKE LONG-TERM BOND REPURCHASE PROGRAMME. The programme started being implemented on September 10, 2026. The US Treasury could use its near $1 trillion General Account (TGA) to help fund its announced plans to increase purchases of government bonds. The move could increase market liquidity, potentially weighing on the U.S. dollar and supporting AUD/USD prices.
TECHNICAL ANALYSIS:
- LONGER-TERM UPTREND CHANNEL: The chart indicates that AUD/USD has been trading within a rising channel since September 2025, with higher highs and higher lows supporting the broader positive structure. The pair continues to respect the channel boundaries.
- 100-DAY MOVING AVERAGE (MA): AUD/USD has recently bounced off its 100-day moving average, reinforcing it as dynamic support. The fact that the price remains above the 100-day MA confirms that positive momentum is still intact. However, a clean break below this level could indicate the beginning of a negative trend.
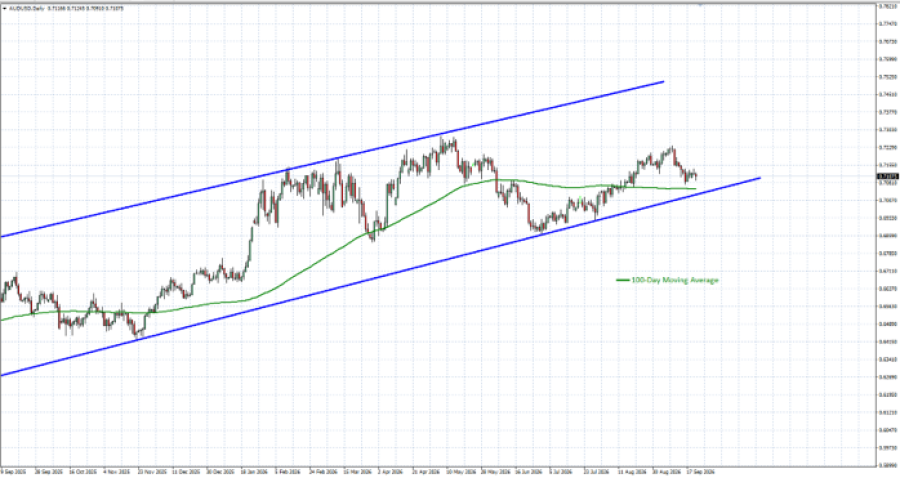
GRAPH (Daily): September 2025– September 2026
Please note that past performance does not guarantee future results
AUD/USD, September 22, 2026
Current Price: 0.7100
|
AUD/USD |
Weekly |
|
Market Trend |
|
|
0.7350 |
|
|
0.7280 |
|
|
0.7220 |
|
|
0.6990 |
|
|
0.6970 |
|
|
0.6950 |
Example of calculation based on weekly market trend for 1.00 Lot1
|
AUD/USD |
||||||
|
Pivot Points |
||||||
|
Profit or loss in $ |
2,500 |
1,800 |
1,200 |
-1,100 |
-1,300 |
-1,500 |
|
Profit or loss in €2 |
2,182 |
1,571 |
1,047 |
-960 |
-1,134 |
-1,309 |
|
Profit or loss in £2 |
1,871 |
1,347 |
898 |
-823 |
-973 |
-1,123 |
|
Profit or loss in C$2 |
3,511 |
2,528 |
1,685 |
-1,545 |
-1,825 |
-2,106 |
1. The above calculations are made based on 1.00 lot which is equivalent of 100,000 units
2. Calculations for exchange rate used as of 13:00 (GMT+1) 22/9/2026
You can use risk management tools such as Stop-Loss and Take-Profit


