PALLADIUM
November 9, 2026
Risk Disclaimer: The example below is for illustrative purposes only and is based on price movements derived from Contracts for Difference (CFDs). The calculations reflect hypothetical outcomes using historical or specified price data for the relevant instrument on the stated date and are not indicative of future performance. Any reliance placed on this material is strictly at the user’s own risk.
Weekly Special Report: Palladium
PALLADIUM USE AND MARKET SHARE:
- PALLADIUM DEMAND: Palladium is primarily used in catalytic converters for petrol and hybrid vehicles to reduce harmful emissions. The automotive sector is expected to account for more than 80% of total palladium demand in 2026.
- MAIN PRODUCERS: Russia accounts for approximately 44% of global mined palladium production, followed by South Africa at around 37%, Canada at 8%, and Zimbabwe at slightly less than 8%.
PALLADIUM: SUPPLY OUTLOOK
- RUSSIAN PRODUCTION UNDER PRESSURE: Russia remains a major palladium supplier, with Nornickel accounting for approximately 40% of global production. The company expects its palladium output to decline to 2.415–2.465 million ounces in 2026, compared with 2.725 million ounces in 2025, potentially marking its lowest production level in around 20 years. The decline is linked to depleted ore reserves and difficulties accessing Western mining equipment due to sanctions.
EVENTS (U.S.):
- TUESDAY, NOVEMBER 10, AT 13:30 GMT: U.S. INFLATION (CPI) (OCTOBER) (MONTHLY). U.S. Headline Inflation (CPI) (Monthly) is expected to show a decline from September’s 0.6%. Core Inflation (CPI) (Monthly) is expected to show a decline from September’s 0.3% as well.
NOTE: Year-over-Year (YoY) Rate (Annual): No official annual inflation rate will be published for headline or core CPI because the US government shutdown in October 2025 disrupted data collection, leaving no data for comparison.
- FRIDAY, NOVEMBER 13 AT 13:30 GMT: U.S. PRODUCERS’ PRICE INDEX (PPI) (OCTOBER) (MONTHLY). U.S. Headline PPI (Monthly) is expected to show a decline from September’s 1.3%. Core PPI (Monthly) is expected to show a decline from September’s 0.7% as well.
EVENTS (CHINA):
- MONDAY, NOVEMBER 16 AT 02:00 GMT: CHINA INDUSTRIAL PRODUCTION (OCTOBER) (PREVIOUS: +5.5%). For October, the market will be watching whether industrial activity remains resilient. A result above the previous 5.5% would indicate stronger industrial momentum and could support expectations for Chinese economic growth and palladium demand.
TECHNICAL ANALYSIS
- BREAKING (NOVEMBER 4): PALLADIUM PRICE HITS ITS LOWEST LEVEL IN AROUND 18 MONTHS ($919).
- SUPPORT AREA: $900. According to the weekly chart below, palladium has found strong support around $900 since mid-2017. Most recently, in early November 2026, the price tested levels near $900, reaching an approximately 18-month low of $919.
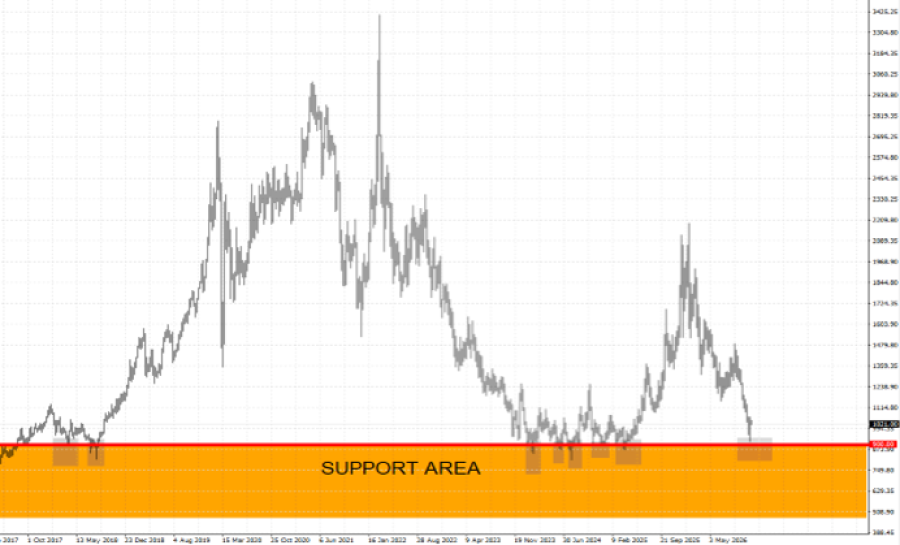
GRAPH (Weekly): February 2017 - November 2026
Please note that past performance does not guarantee future results
Palladium, November 09, 2026
Current Price: 1,019
|
PALLADIUM |
Weekly |
|
Market Trend |
|
|
1,200 |
|
|
1,150 |
|
|
1,120 |
|
|
920 |
|
|
910 |
|
|
900 |
Example of calculation based on weekly market trend for 1.00 Lot1
|
PALLADIUM |
||||||
|
Pivot Points |
||||||
|
Profit or loss in $ |
18,100 |
13,100 |
10,100 |
-9,900 |
-10,900 |
-11,900 |
|
Profit or loss in €² |
16,172 |
11,704 |
9,024 |
-8,845 |
-9,739 |
-10,632 |
|
Profit or loss in £² |
13,489 |
9,762 |
7,527 |
-7,378 |
-8,123 |
-8,868 |
|
Profit or loss in C$² |
25,499 |
18,455 |
14,229 |
-13,947 |
-15,356 |
-16,764 |
- The above calculations are made based on 1.00 lot, which is equivalent to 100 units
- Calculations for the exchange rate used as of 12:30 (GMT) 09/11/2026
You can use risk management tools such as Stop-Loss and Take-Profit


