SK HYNIX (#SKHYNIX)
October 16, 2026
Risk Disclaimer: The example below is for illustrative purposes only and is based on price movements derived from Contracts for Difference (CFDs). The calculations reflect hypothetical outcomes using historical or specified price data for the relevant instrument on the stated date and are not indicative of future performance. Any reliance placed on this material is strictly at the user’s own risk.
Weekly Special Report: SK HYNIX (#SKHYNIX)
SK HYNIX: THE COMPANY
- SK HYNIX is a South Korean semiconductor company that designs, develops, manufactures, and sells advanced memory chips and storage solutions used in smartphones, personal computers, data centers, and AI applications. Founded in 1983, SK Hynix is one of the world's largest memory chip manufacturers and a global leader in advanced memory for AI infrastructure.
- SK HYNIX STOCK IS LISTED ON BOTH THE SOUTH KOREAN STOCK EXCHANGE (KOSPI) AND NASDAQ (SKHY). The company joined the Nasdaq stock exchange in July 2026, making its shares more accessible to U.S. investors.
- SK HYNIX MAIN PRODUCTS: MEMORY CHIPS. These chips store data that processors and artificial intelligence systems need to work.
DRAM (DYNAMIC RANDOM-ACCESS MEMORY): Temporary memory used by processors to run programs and process data.
NAND FLASH MEMORY: Permanent storage used in solid-state drives to keep data when a device is switched off.
HIGH-BANDWIDTH MEMORY (HBM): Very fast memory used by artificial intelligence chips in servers and data centers. SK Hynix is one of the world's leading manufacturers.
SK HYNIX: MEMORY CHIP MARKET SHARE
- HIGH-BANDWIDTH MEMORY (HBM): SK Hynix holds a 50% market share, Samsung holds 32%, while Micron holds 18%.
- DRAM: SK Hynix holds a 25% market share, Samsung holds 38%, Micron holds 24%, while CXMT holds 10% and other manufacturers account for the remaining 3%.
- NAND FLASH: SK Hynix holds a 19% market share, Samsung holds 28%, Micron holds 15%, while Kioxia holds 14% and other manufacturers account for the remaining 24%.
Source: Counterpoint Research
SK HYNIX: Q3 EARNINGS
- EVENT (WEDNESDAY, OCTOBER 28): Q3 2026 EARNINGS REPORT. SK Hynix is expected to report $74.226 billion in revenue, an increase of approximately 321% year on year (vs. $17.631 billion last year). Net income is expected to reach $44.958 billion, up approximately 651% year on year from $5.985 billion.
EXPECTED FORWARD GUIDANCE (Q4): SK Hynix is expected to report $84.886 billion in revenue for Q4 2026, representing an increase of approximately 289% year on year (vs. $21.848 billion last year).
- LAST 10 QUARTERS: SK Hynix has beaten revenue expectations in 8 of the last 10 quarters and net income expectations in 9 of the last 10 quarters, demonstrating a strong track record of exceeding analyst forecasts.
Source: Bloomberg Terminal
SK HYNIX: NEWS
- BREAKING (OCTOBER 15): SK HYNIX CONSIDERS NEW U.S. CHIP FACTORY LINKED TO CHINA EXPANSION. According to Reuters, SK Hynix is seeking U.S. approval to export chipmaking equipment to its Dalian factory in China, allowing its subsidiary Solidigm to increase NAND memory production. The additional production could help finance a new NAND factory in the U.S., benefiting from strong demand for AI data-center storage.
SK HYNIX: TECHNICAL ANALYSIS AND PRICE ACTION
- BREAKING (SEPTEMBER 9, 2026): SK HYNIX STOCK PRICE HIT ITS HIGHEST LEVEL SINCE IT JOINED THE NASDAQ STOCK EXCHANGE IN JULY 2026 ($199.34). SK Hynix stock currently trades at $141. If it fully recovers to its previous high, it could see upside potential of around 41%. However, the stock could also decline.
- SUPPORT AREA: $140–$130. SK Hynix stock has traded predominantly above the $140–$130 range over the past three months, suggesting that this region has established itself as a support zone.
- FORECAST (Source: Bloomberg Terminal): Barclays: $300; BNP Paribas: $221; UBS: $220; JPMorgan: $245; HSBC: $240; Rosenblatt Securities: $320; Needham: $355.
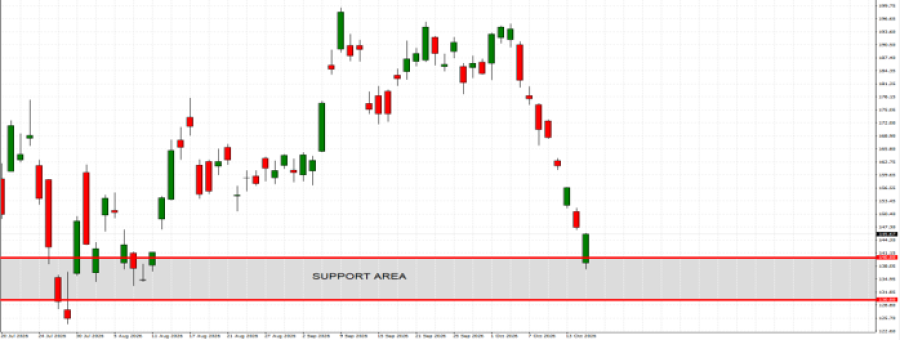
GRAPH (Daily): July 2026 – October 2026
Please note that past performance does not guarantee future results
#SKHYNIX, October 16, 2026
Current Price: 141
|
SK HYNIX |
Weekly |
|
Market Trend |
|
|
200 |
|
|
180 |
|
|
160 |
|
|
128 |
|
|
124 |
|
|
120 |
Example of calculation based on weekly market trend for 1.00 Lot1
|
SK HYNIX |
||||||
|
Pivot Points |
||||||
|
Profit or loss in $ |
29,500 |
19,500 |
9,500 |
-6,500 |
-8,500 |
-10,500 |
|
Profit or loss in €2 |
26,202 |
17,320 |
8,438 |
-5,773 |
-7,550 |
-9,326 |
|
Profit or loss in £2 |
22,119 |
14,621 |
7,123 |
-4,874 |
-6,373 |
-7,873 |
|
Profit or loss in C$2 |
41,748 |
27,596 |
13,444 |
-9,199 |
-12,029 |
-14,859 |
- The above calculations are made based on 1.00 lot which is equivalent of 500 units
- Calculations for exchange rate used as of 10:30 (GMT+1) 16/10/2026
You can use risk management tools such as Stop-Loss and Take-Profit.


