February 2, 2023

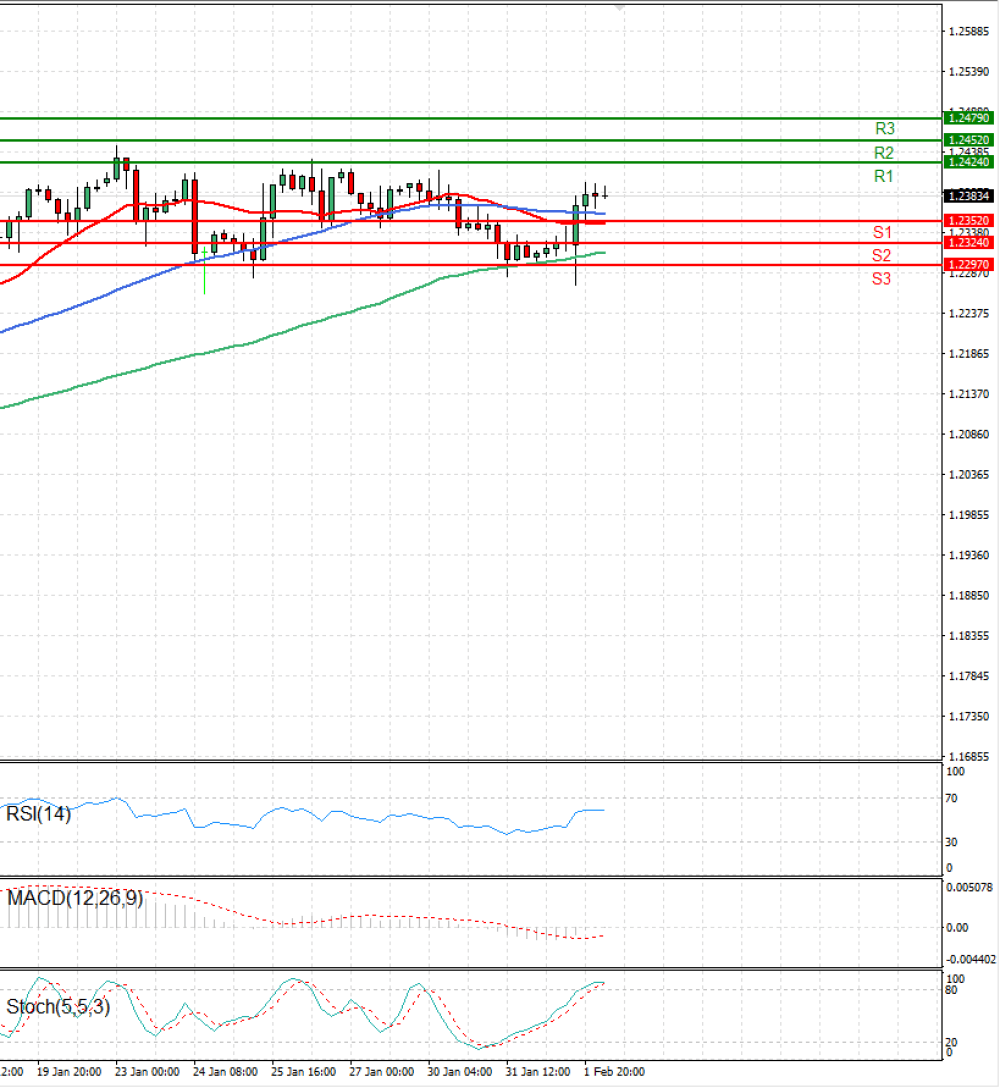
| Support & Resistance Table | Level | Explanation |
|---|---|---|
| Resistance 2 | 1.2452 | Daily R2 |
| Resistance 1 | 1.2424 | Daily R1 |
| Support 1 | 1.2352 | Daily S1 |
| Support 2 | 1.2324 | Daily S2 |
| Indicator | Signal |
|---|---|
| SMA 20 | BUY |
| SMA 50 | BUY |
| SMA 100 | BUY |
| MACD( 12;26;9) | SELL |
| RSI (14) | NEUTRAL |
| Stochastic ( 9;6;3) | NEUTRAL |
| Indicator / Period | Day BUY | Week BUY | Month BUY |
|---|---|---|---|
| MACD( 12;26;9) | SELL | BUY | BUY |
| RSI (14) | NEUTRAL | BUY | BUY |
| SMA 20 | BUY | BUY | BUY |
| Status | Subject | SMS status | Indicators status |
|---|---|---|---|
| BUY | Simple Moving Average | Buy (3) | Sell (0) |
| Technical Indicators - Oscillators | Buy (0) | Sell (1) |
Fortrade Canada Ltd. as an order-execution only dealer is not permitted to provide you with any advice or recommendations. These Market Commentaries should not be construed as a recommendation, advice or any attempt by Fortrade Canada Ltd. to prompt or influence you in making an investment decision to purchase, sell, hold or exchange any security or to influence the timing of such activity. This content is produced by Fortrade Limited which is not registered in any capacity with any securities regulatory authority in Canada.