Oro - Dólar estadounidense Análisis 14/10/2026
October 14, 2026
Análisis fundamental
Análisis Técnicos
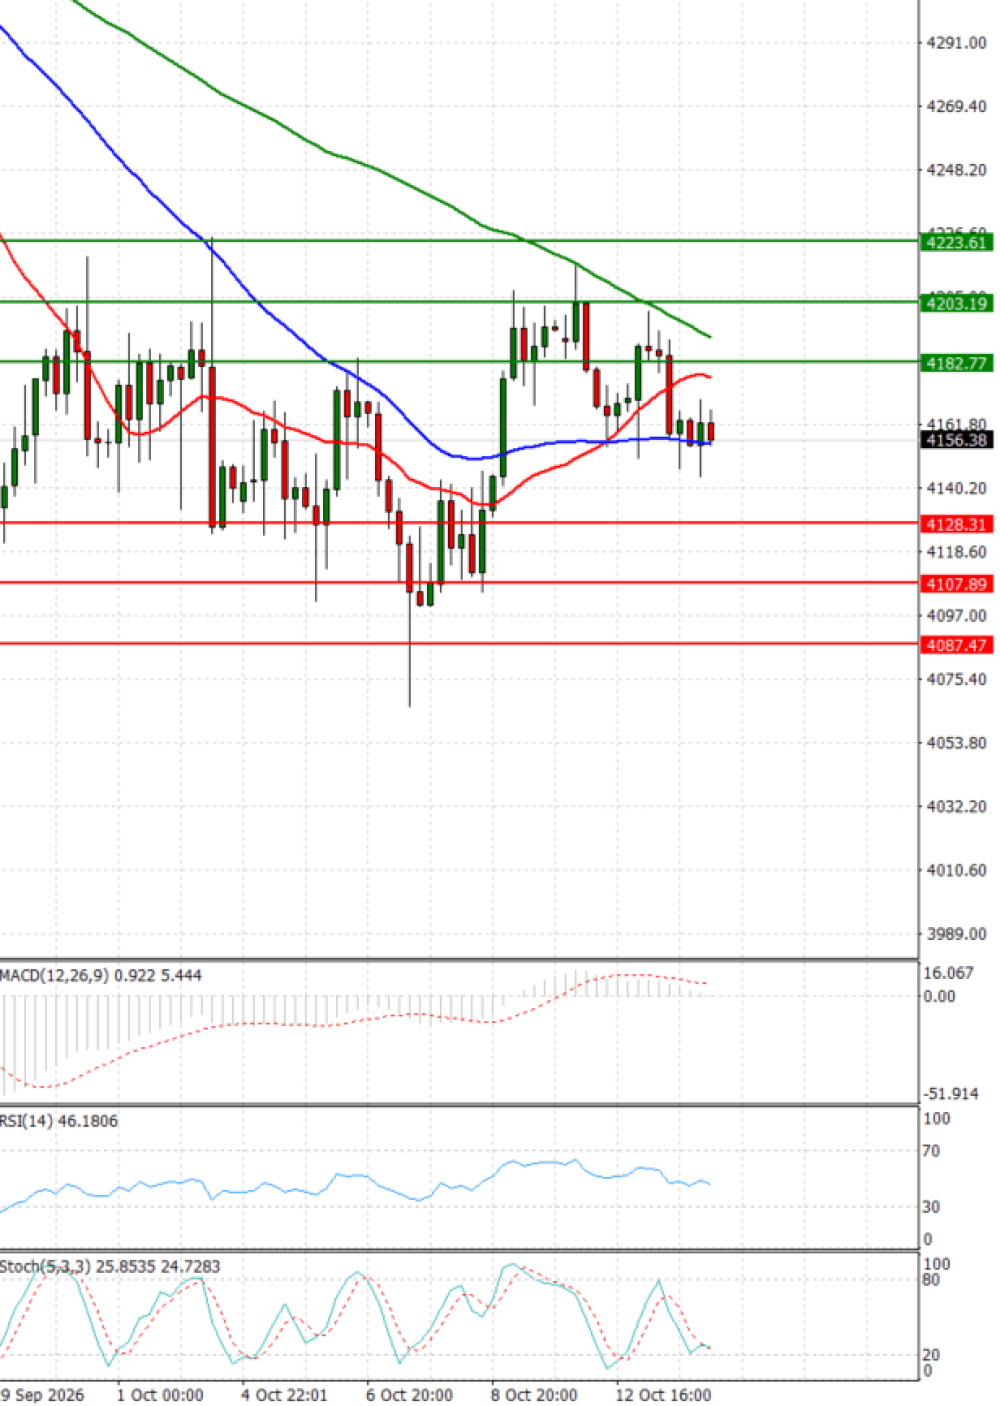
Gold Tabla de soporte y resistencia - 2026-10-14
| Tabla de soporte y resistencia | Nivel | Explicación |
|---|---|---|
| Resistencia 2 | 4203.19 | R2 Diario |
| Resistencia 1 | 4182.77 | R1 Diario |
| Soporte 1 | 4128.31 | Daily S1 |
| Soporte 2 | 4107.89 | S2 Diario |
Gold Tabla de indicadores - 2026-10-14
| Indicador | Señal |
|---|---|
| SMA 20 | SELL |
| SMA 50 | SELL |
| SMA 100 | SELL |
| MACD( 12;26;9) | BUY |
| RSI (14) | SELL |
| Stochastic ( 9;6;3) | SELL |
Gold Tabla de indicadores / periodos - 2026-10-14
| Indicador / Periodo | Día SELL | Semana SELL | Mes SELL |
|---|---|---|---|
| MACD( 12;26;9) | BUY | SELL | SELL |
| RSI (14) | SELL | SELL | SELL |
| SMA 20 | SELL | SELL | SELL |
Gold 2026-10-14 - Precio de Referencia : 4155.54
| Status | Subject | SMS status | Indicators status |
|---|---|---|---|
| SELL | Media Móvil Simple | Compra (0) | Venta (3) |
| Indicadores técnicos - Osciladores | Compra (1) | Venta (2) |


