Dollar - Japanese Yen Analysis Analysis 16/10/2026
October 16, 2026
Fundamental analysis
Technical analysis
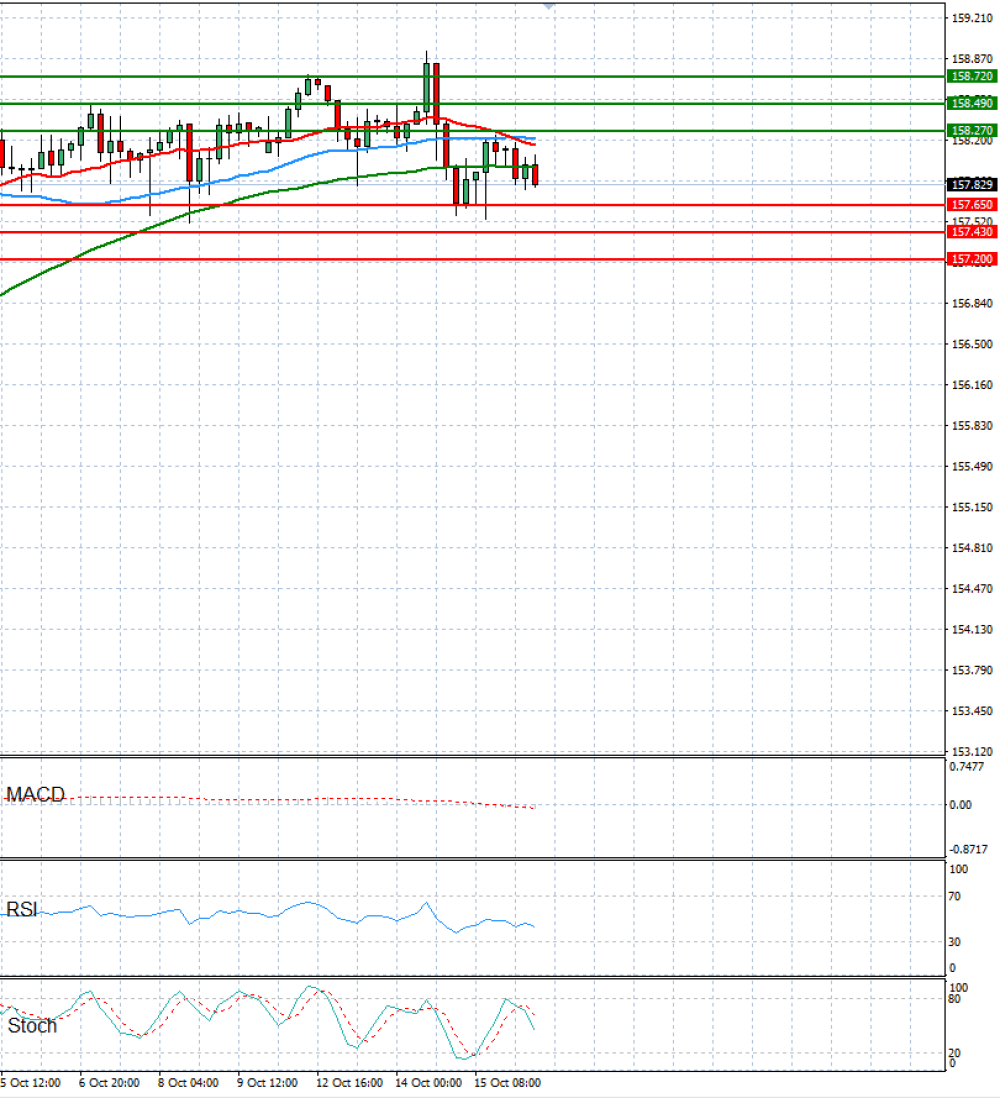
USD-JPY Support & Resistance Table - 2026-10-16
| Support & Resistance Table | Level | Explanation |
|---|---|---|
| Resistance 2 | 158.49 | Daily R2 |
| Resistance 1 | 158.27 | Daily R1 |
| Support 1 | 157.65 | Daily S1 |
| Support 2 | 157.43 | Daily S2 |
USD-JPY Indicator Table - 2026-10-16
| Indicator | Signal |
|---|---|
| SMA 20 | SELL |
| SMA 50 | SELL |
| SMA 100 | SELL |
| MACD( 12;26;9) | SELL |
| RSI (14) | SELL |
| Stochastic ( 9;6;3) | SELL |
USD-JPY Indicator / Period Table - 2026-10-16
| Indicator / Period | Day SELL | Week SELL | Month BUY |
|---|---|---|---|
| MACD( 12;26;9) | SELL | BUY | BUY |
| RSI (14) | SELL | SELL | NEUTRAL |
| SMA 20 | SELL | SELL | BUY |
USD-JPY 2026-10-16 - Reference Price : 157.83
| Status | Subject | SMS status | Indicators status |
|---|---|---|---|
| SELL | Simple Moving Average | Buy (0) | Sell (3) |
| Technical Indicators - Oscillators | Buy (0) | Sell (3) |


