COPPER
October 12, 2026
Weekly Special Report: Copper
COPPER USE AND MARKET SHARE:
- TOP COPPER PRODUCERS: Chile (23% of global mine production), the Democratic Republic of the Congo (14%), Peru (11%), China (8%), the United States (5%), Indonesia (4%), Russia (4%), Zambia (4%), Australia (3%), Mexico (3%), Kazakhstan (3%), and Canada (2%).
- TOP COPPER CONSUMERS: China (58% of the world’s total), the European Union (8%), the United States (7%), and Japan (4%).
- TOP COPPER INDUSTRIES: Copper is heavily demanded in the EV (Electric Vehicles) industry, renewable energy industry (wind & solar farms), electrical infrastructure, telecommunications, and construction. The EV and green industries show the biggest growth rates (10-15% and 5%, respectively).
EVENTS (U.S.A.):
- WEDNESDAY, OCTOBER 14 AT 13:30 GMT+1: U.S. CPI INFLATION (SEPTEMBER). U.S. inflation remains a key focus for the Fed. A lower-than-expected CPI reading could ease rate hike expectations and support copper prices. U.S. headline inflation currently stands at 3.4%.
- THURSDAY, OCTOBER 15 AT 13:30 GMT+1: U.S. RETAIL SALES (SEPTEMBER). U.S. retail sales provide insight into consumer spending and economic growth. Weaker-than-expected data could signal slowing economic activity, easing Fed rate hike expectations and support copper prices.
- OCTOBER 15 AT 13:30 GMT+1: U.S. PRODUCERS’ PRICE INDEX (PPI) INFLATION (SEPTEMBER). U.S. producer prices offer insight into inflationary pressures. A lower-than-expected PPI reading could ease Fed rate hike expectations and influence copper prices. Headline PPI currently stands at 5.4%.
EVENTS (CHINA):
- WEDNESDAY, OCTOBER 14 AT 02:30 GMT+1: CHINA INFLATION (CPI) (SEPTEMBER). China’s inflation data will offer insight into domestic demand and economic health. Stronger-than-expected figures could support copper prices.
- WEDNESDAY, OCTOBER 14 AT 04:00 GMT+1: CHINA EXPORTS AND IMPORTS (SEPTEMBER). China’s trade data will provide insight into global demand and economic activity. Stronger-than-expected figures could support copper prices.
- MONDAY, OCTOBER 19 AT 03:00 GMT+1: CHINA INDUSTRIAL PRODUCTION (SEPTEMBER). China’s industrial production data will provide insight into manufacturing activity and copper demand, as China is the world’s largest copper consumer. Stronger-than-expected growth could support copper prices.
TECHNICAL ANALYSIS:
- UPTREND: Copper prices have risen around 40% over the past year. However, copper prices could decline, too.
- SUPPORT AREA: $6.550 - $6.450: The area between $6.550 and $6.450 has acted as a support region since early May 2026.
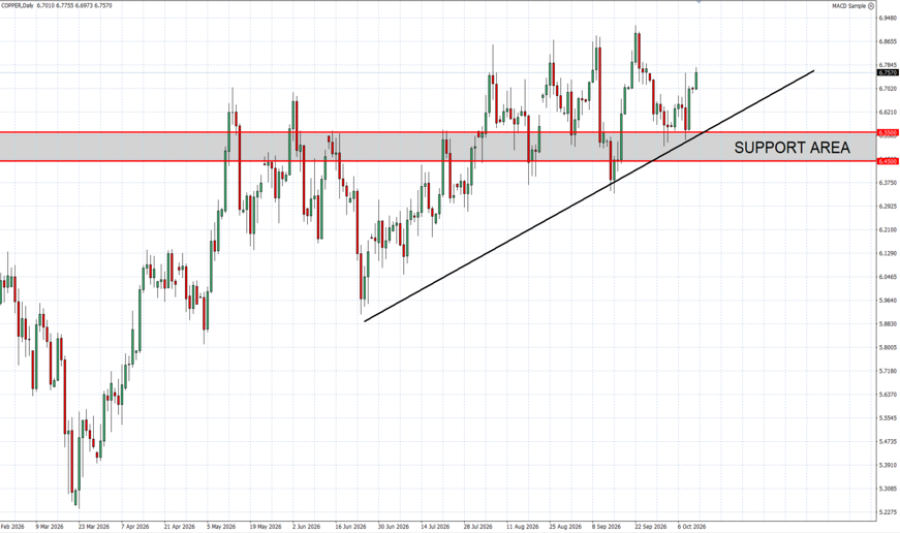
GRAPH (Daily): February 2026 – October 2026
Please note that past performance does not guarantee future results
Copper, October 12, 2026
Current Price: 6.740
|
COPPER |
Weekly |
|
Market Trend |
|
|
7.500 |
|
|
7.200 |
|
|
7.000 |
|
|
6.500 |
|
|
6.475 |
|
|
6.450 |
Example of calculation based on weekly market trend for 1.00 Lot1
|
COPPER |
||||||
|
Pivot Points |
||||||
|
Profit or loss in $ |
7,600 |
4,600 |
2,600 |
-2,400 |
-2,650 |
-2,900 |
|
Profit or loss in €2 |
6,801 |
4,116 |
2,327 |
-2,148 |
-2,371 |
-2,595 |
|
Profit or loss in £2 |
5,744 |
3,477 |
1,965 |
-1,814 |
-2,003 |
-2,192 |
|
Profit or loss in C$2 |
10,838 |
6,560 |
3,708 |
-3,423 |
-3,779 |
-4,136 |
- The above calculations are made based on 1.00 lot which is equivalent of 10,000 units
- Calculations for exchange rate used as of 13:50 (GMT+1) 12/10/2026
You can use risk management tools such as Stop-Loss and Take-Profit


